
In economics, a production–possibility curve (PPC), is also called a production–possibility frontier (PPF), production-possibility boundary or product transformation curve, is a graph that compares the production rates of two commodities that use the same fixed total of the factors of production. Graphically bounding the production set, the PPF curve shows the maximum specified production level of one commodity that results given the production level of the other. By doing so, it defines productive efficiency in the context of that production set.
Let us consider the shape and use of the production possibility curve. In our discussion we make the following assumptions:
(1) Only two goods, X and Y, are being produced.
(2) Only one factor of production is used in the production. That factor of production is labour. Supply of labour in the economy is fixed and total amount of labour is fully employed.
(3) The two goods can be produced in various ratios. This means that the country can produce more of X and less of Y or less X and more of Y.
(4) In the production of both goods, law of increasing cost operates. This means that if the production of one good rises, its marginal cost will rise.
(5) There is no change in production process or production technology. With the help of these assumptions we can explain how the production possibility curve can be obtained.
• Suppose the country can produce different alternative combinations of X and Y with its given amount of labour.
• Those combinations are shown with the help of the following hypothetical schedule:
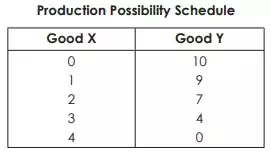
•From this schedule we see that if the country produces only Y and no amount of good X, then it can produce a maximum of 10 units of Y. So, we get a combination (0, 10) on the production possibility curve.
• Again, if the country does not produce good Y and devote its entire resources in the production of X, then it can produce a maximum of 4 units of X. Hence, point (4, 0) will be a combination of two goods on the production possibility curve.
• In this way, employing the entire resource (labour), the country can produce 1 unit of good X and 9 units of good Y, or 2 units of good X and 7 units of good Y, etc.
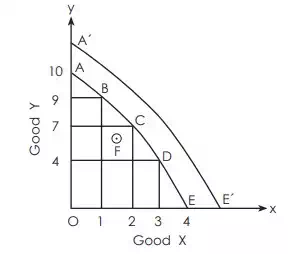
• In our figure, we plot the amount of good X (say, x) on the horizontal axis and the amount of good Y (say, y) on the vertical axis.
• In this figure, AE is the production possibility curve.