Gantt charts can get a bad rap these days in some circles. Maybe it’s because they are associated with Waterfall in an age where so many are talking about Agile (for better or worse). Or maybe it’s because they’re just old. The fact is, Gantt charts have and will continue to persevere for a reason; they are the best way to visualize tasks or events in a chronological timeline. Many teams are rediscovering the value of Gantt charts for Agile, outside of Waterfall.
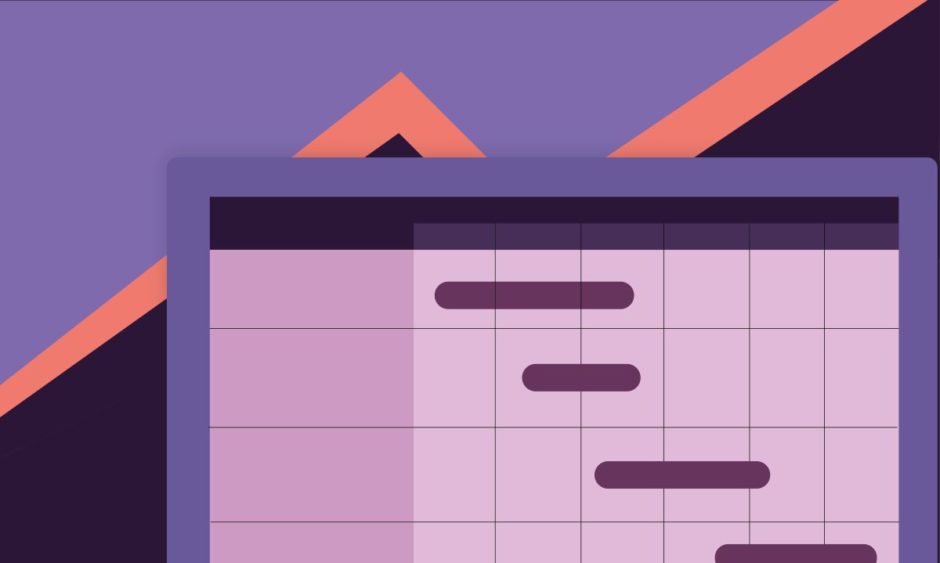
Below is a zoomed-in image of the example Gantt chart.
Benefits of using a Gantt chart
To give you a clearer idea of what Gantt charts can do for your next project, here are 6 known benefits from using Gantt charts to manage your project:
1) Peace of mind
Laying out all the steps, and how they connect, give you a level of comfort in hitting your deadline or goal. You can see the big picture, and visualize the steps to completion.
2) Easily communicate the plan with others
Communication is critical in any project. Giving everyone a visual map helps make sure that all involved are on the same page.
3) Prevent resource overload
If your Gantt chart includes resource management, you can see at a glance who is overloaded and who has capacity.
4) Track the progress of your project
Are you tracking ahead of schedule or are you behind? A Gantt chart can tell you at a glance. You can also set baselines to look back and see how the plan changed over time.
5) Free up brain space
Once you have a plan, there is no need to stress about remembering the next steps, who is doing what, or what may have been forgotten. Everything is in the Gantt chart. You can now use your precious time and effort for the execution.
6) Clarity and motivation
Members of a project can see when they need to get their tasks done. They can also see if future tasks depend on them. When others see exactly what their role is in a project and how others depend on them, it provides real motivation!
Gantt charts are absolutely essential on projects that have a deadline to meet, with a series of interconnected tasks that need to get done in a particular order to hit that deadline. You can use a pen and paper, Excel or purpose-built tools like Microsoft Project or TeamGantt to build a Gantt chart. If you are most comfortable in Excel, you can download our free Gantt chart template to get a head start. Alternatively, you can start building in our free web-based Gantt chart software.
The basic elements of a Gantt chart
Regardless of what you are using to build your Gantt charts, all share some common traits.
There are 3 basic elements of a Gantt chart:
1. Tasks
2. Dependencies
3. Milestones
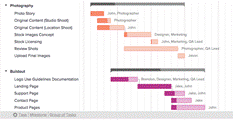
You can see in this example that each task is represented as a bar that spans the amount of time that task should take. There are multiple groups of tasks such as “Photography” and “Buildout”. This is an easy way to organize and group tasks together. Those groups also have a grey bar to show at a higher level how long a group of tasks will take. If you want to show a high level plan that is less cluttered, you can hide the individual tasks and only show these group bars.
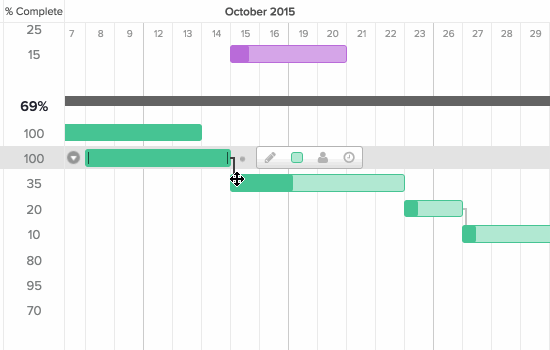
You can also link tasks together by creating dependencies between tasks. A dependency is a visual way to show that one task depends on something happening in another task. The most popular usage is to show that in order for Task B to start, Task A needs to finish. In a good tool, a dependency will also lock tasks together, so if you move Task A out, Task B will also be moved out, allowing you to quickly see how one small movement can ripple out and affect the whole project. This really can’t be done in an Excel Gantt chart, so if you want to use dependencies you could use a project management tool like TeamGantt.
Dependencies let you link tasks together.
Milestones provide a very easy way to see important dates at a glance. This allows others who view your Gantt chart to quickly see the big important dates. It’s also a great feeling to complete the milestone and check it off when it’s complete!
This is just the tip of the iceberg, but armed with these basic components, you can go out and plan most projects. So get out there and start planning.