
Let’s illustrate the concept of activity based costing by looking at two common manufacturing activities: (1) the setting up of a production machine for running batches of products, and (2) the actual production of the units of product.
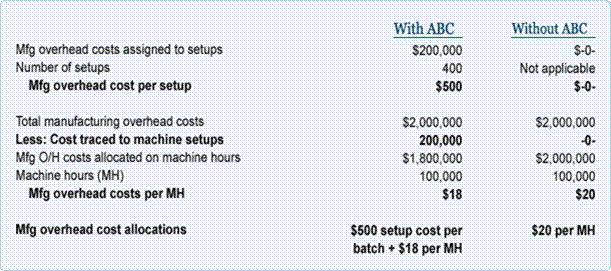
We will assume that a company has annual manufacturing overhead costs of $2,000,000—of which $200,000 is directly involved in setting up the production machines. During the year the company expects to perform 400 machine setups. Let’s also assume that the batch sizes vary considerably, but the setup efforts for each machine are similar.
The cost per setup is calculated to be $500 ($200,000 of cost per year divided by 400 setups per year). Under activity based costing, $200,000 of the overhead will be viewed as a batch-level cost. This means that $200,000 will first be allocated to batches of products to be manufactured (referred to as a Stage 1 allocation), and then be assigned to the units of product in each batch (referred to as Stage 2 allocation). For example, if Batch X consists of 5,000 units of product, the setup cost per unit is $0.10 ($500 divided by 5,000 units). If Batch Y is 50,000 units, the cost per unit for setup will be $0.01 ($500 divided by 50,000 units). For simplicity, let’s assume that the remaining $1,800,000 of manufacturing overhead is caused by the production activities that correlate with the company’s 100,000 machine hours.
For our simple two-activity example, let’s see how the rates for allocating the manufacturing overhead would look withactivity based costing and without activity based costing:
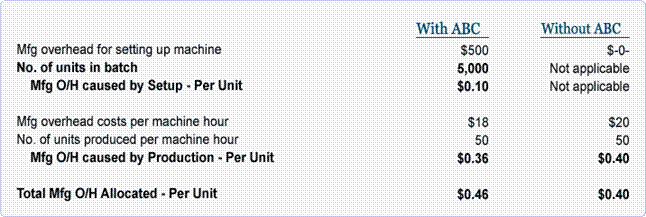
Next, let’s see what impact these different allocation techniques and overhead rates would have on the per unit cost of a specific unit of output. Assume that a company manufactures a batch of 5,000 units and it produces 50 units per machine hour, here is how the cost assigned to the units with activity based costing and without activity based costing compares:
If a company manufactures a batch of 50,000 units and produces 50 units per machine hour, here is how the cost assigned to the units with ABC and without ABC compares:
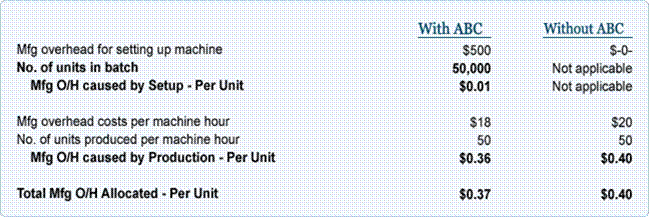
As the tables above illustrate, with activity based costing the cost per unit decreases from $0.46 to $0.37 because the cost of the setup activity is spread over 50,000 units instead of 5,000 units. Without ABC, the cost per unit is $0.40 regardless of the number of units in each batch. If companies base their selling prices on costs, a company not using an ABC approach might lose the large batch work to a competitor who bids a lower price based on the lower, more accurate overhead cost of $0.37. It’s also possible that a company not using ABC may find itself being the low bidder for manufacturing small batches of product, since its $0.40 is lower than the ABC model of $0.46 for a batch size of 5,000 units. With its bid price based on manufacturing overhead of $0.40—but a true cost of $0.46—the company may end up doing lots of production for little or no profit.
Our example with just two activities (production and setup) illustrates how the cost per unit using the activity based costing method is more accurate in reflecting the actual efforts associated with production. As companies began measuring the costs of activities (instead of focusing on the accountant’s departmental classifications), they began using ABC cost information to practice activity based management. For example, with the cost of setting up a machine now being measured and discussed, managers began to ask questions such as:
Why is the cost of setting up a production machine so expensive?
What can be done to reduce the setup cost?
If the setup costs cannot be reduced, are the selling prices adequate to cover all of the company’s costs—including the setup cost that was previously buried in the overall machine-hour overhead rate?
