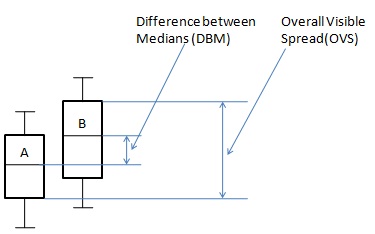
Groups of population can be compared using box and whisker plots. Overall visible spread and difference between median is used to draw conclusion that there tends to be a difference between two groups or not.
Case 2: Formula
P=DBMOVS×100P=DBMOVS×100
Where −
· PP = percentage difference
· DBMDBM = Difference Between Medians.
· OVSOVS = Overall Visible Spread.
Rules
· For a sample size of 30 if this percentage is greater than 33% there tends to be a difference between two groups.
· For a sample size of 100 if this percentage is greater than 20% there tends to be a difference between two groups.
· For a sample size of 1000 if this percentage is greater than 10% there tends to be a difference between two groups.
Example
Problem Statement:
Describe the difference between following sets of data.
| Sr. No. | Name | Set A | Set B |
| 1 | Max | 12 | 15 |
| 2 | UQ | 10 | 13 |
| 3 | Median | 7 | 10 |
| 4 | LQ | 6 | 9 |
| 5 | Min | 5 | 6 |
Solution:
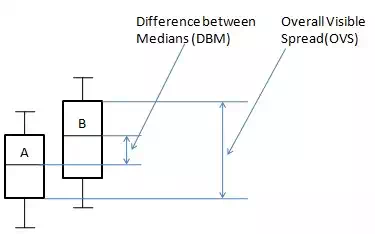
Consider the following diagram:
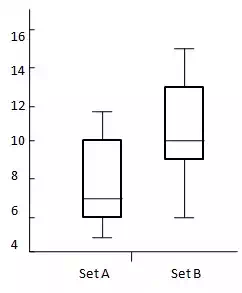
OVS=13−6 =7 DBM=10−3 =4OVS=13−6 =7 DBM=10−3 =4
Apply the formula
P=DBMOVS×100 =47×100 =57.14P=DBMOVS×100 =47×100 =57.14
As percentage is over 33% thus there is difference between Set A and Set B. It is likely that Set B is greater than Set A.