Logistic regression is a statistical method for analyzing a dataset in which there are one or more independent variables that determine an outcome. The outcome is measured with a dichotomous variable (in which there are only two possible outcomes).
Formula
π(x)=eα+βx1+eα+βxπ(x)=eα+βx1+eα+βx
Where −
· Response – Presence/Absence of characteristic.
· Predictor – Numeric variable observed for each case
· β=0⇒β=0⇒ P (Presence) is the same at each level of x.
· β>0⇒β>0⇒ P (Presence) increases as x increases
· β=0⇒β=0⇒ P (Presence) decreases as x increases.
Example
Problem Statement:
Solve the logistic regression of the following problem Rizatriptan for Migraine
Response – Complete Pain Relief at 2 hours (Yes/No).
Predictor – Dose (mg): Placebo (0), 2.5,5,10
| Dose | #Patients | #Relieved | %Relieved |
| 0 | 67 | 2 | 3.0 |
| 2.5 | 75 | 7 | 9.3 |
| 5 | 130 | 29 | 22.3 |
| 10 | 145 | 40 | 27.6 |
Solution:
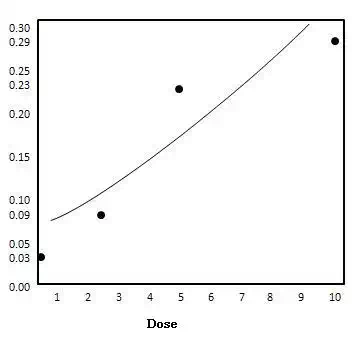
Having α=−2.490andα=−2.490and{\beta = .165}, we’ve following data:
π(0)=eα+β×01+eα+β×0=e−2.490+01+e−2.490=0.03π(2.5)=eα+β×2.51+eα+β×2.5=e−2.490+.165×2.51+e−2.490+.165×2.5=0.09π(5)=eα+β×51+eα+β×5=e−2.490+.165×51+e−2.490+.165×5=0.23π(10)=eα+β×101+eα+β×10=e−2.490+.165×101+e−2.490+.165×10=0.29π(0)=eα+β×01+eα+β×0=e−2.490+01+e−2.490=0.03π(2.5)=eα+β×2.51+eα+β×2.5=e−2.490+.165×2.51+e−2.490+.165×2.5=0.09π(5)=eα+β×51+eα+β×5=e−2.490+.165×51+e−2.490+.165×5=0.23π(10)=eα+β×101+eα+β×10=e−2.490+.165×101+e−2.490+.165×10=0.29
| Dose(xx) | π(x)π(x) |
| 0 | 0.03 |
| 2.5 | 0.09 |
| 5 | 0.23 |
| 10 | 0.29 |