
Quadratic regression is deployed to figure out an equation of the parabola which can best fit the given set of data. It is of following form:
y=ax2+bx+c where a≠0y=ax2+bx+c where a≠0
Least square method can be used to find out the Quadratic Regression Equation. In this method, we find out the value of a, b and c so that squared vertical distance between each given point (xi,yixi,yi) and the parabola equation (y=ax2+bx+2y=ax2+bx+2) is minimal. The matrix equation for the parabolic curve is given by:
⎡⎣⎢∑xi4∑xi3∑xi2∑xi3∑xi2∑xi∑xi2∑xin⎤⎦⎥⎡⎣⎢abc⎤⎦⎥=⎡⎣⎢∑xi2yi∑xiyi∑yi⎤⎦⎥[∑xi4∑xi3∑xi2∑xi3∑xi2∑xi∑xi2∑xin][abc]=[∑xi2yi∑xiyi∑yi]
Correlation Coefficient, r
Correlation coefficient, r determines how good a quardratic equation can fit the given data. If r is close to 1 then it is good fit. r can be computed by following formula.
r=1−SSESST where SSE=∑(yi−axi2−bx+i−c)2 SST=∑(yi−y¯)2r=1−SSESST where SSE=∑(yi−axi2−bx+i−c)2 SST=∑(yi−y¯)2
Generally, quadratic regression calculators are used to compute the quadratic regression equation.
Example
Problem Statement:
Compute the quadratic regression equation of following data. Check its best fitness.
| x | -3 | -2 | -1 | 0 | 1 | 2 | 3 |
| y | 7.5 | 3 | 0.5 | 1 | 3 | 6 | 14 |
Solution:
Compute a quadratic regression on calculator by putting the x and y values. The best fit quadratic equation for above points comes as
y=1.1071×2+0.5714xy=1.1071×2+0.5714x
To check the best fitness, plot the graph.
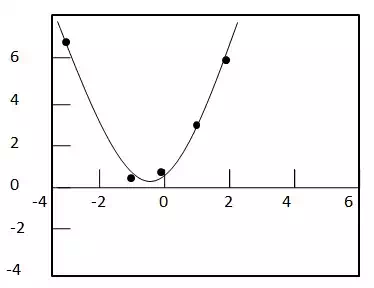
So the value of Correlation Coefficient, r for the data is 0.99420 and is close to 1. Hence quadratic regression equation is best fit.