As described in section 3.3.4, the Micro-Optimizing gene represents the adaptive nature of a given project’s development processes. In an Agile project, we can model this by recognizing that at the end of each iteration, the team tweaks and fine tunes the process to gain small gains in Productivity, FCC, and a small improvement in Rework Discovery. Additionally, the team learns over time what their work capacity is, and they dynamically adjust the size of each sprint by reducing or increasing the amount of work they choose to tackle in the next sprint, based on performance in a previous sprint.
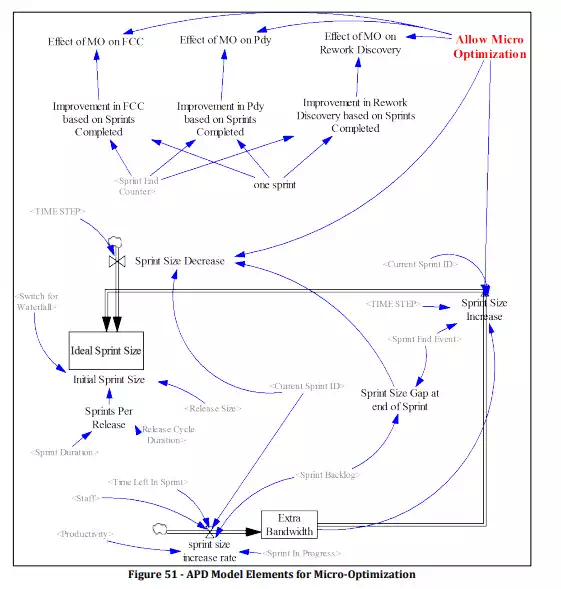
Figure 51 shows how we add this to our APD model. At the end of each iteration, if any work is remaining in the Sprint Backlog, it represents the “gap” between the size of the previous sprint and the amount of work that the team was able to accomplish. This gap is represented by the variable Sprint Size Gap at end of Sprint. This gap amount is used to decrease Ideal Sprint Size, at the next Sprint End Event. Ideal Sprint Size will be used to set the variable controlling the size of the next sprint, Sprint Size. On the other hand, if the team finishes all of the Sprint Backlog work before the end of the sprint, the Time Left In Sprint at that point is used to determine how much Extra Bandwidth the team had to spare in that sprint, and that amount will be used to increase the size of the next sprint via the Sprint Size Increase flow.
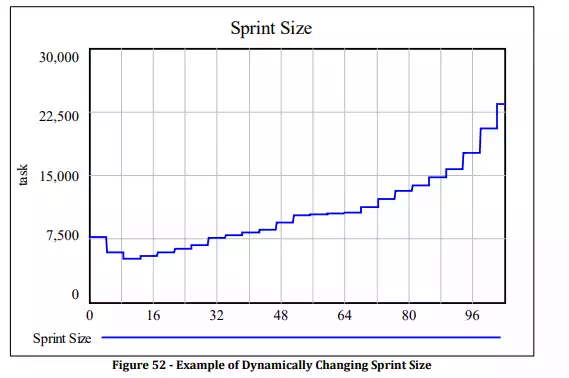
Figure 52 above shows the behavior produced when we turn on the control Allow Micro-Optimization: a dynamically changing Sprint Size over time when running this model. We interpret this graph as follows: the team selects an initial sprint size of 7500 tasks, based on initial project parameters (Sprint Duration, Number of Releases, and Release Size). Then, as development work proceeds, the team learns and adapts while dynamically changing the sprint size, which represents how much work the team can handle within a single sprint. At first, there is a dip in this capacity, as the project is still assimilating its’ new inexperienced staff, and while requirements are still uncertain. As the project progresses, the team becomes more and more productive, while generating less defects, allowing them to bite off larger amounts of work as the project proceeds. This behaviour matches what is observed in industry: Scrum teams report that after a dozen or more sprints they become “fine-tuned” and capable of tackling more work per sprint.
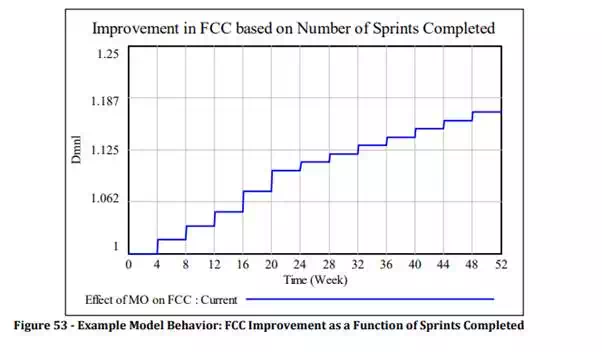
The other set of effects that we have gathered under the micro-optimization genes, as discussed earlier, are its effects on Fraction Correct and Complete, on Rework Discovery Time, and on Productivity. In its current form the APD model uses a simple approach for modelling these simply as a function of the number of sprints completed. In other words, the more sprints, the better the team performs along these dimensions. Quantifying this however is a difficult task, much like quantifying technical debt. A good approach here would be to derive these numbers from historical performance data. For the purposes of our modelling, we use a simple lookup table with very conservative values. This produces the following improvement over time for FCC, for example as seen in Figure 53.