As described previously, creating a “CI Environment” means acquiring, installing, and configuring the tools and servers necessary to support CI. This may include custom scripting and development to automate certain aspects of the build process, or even modification of the software product to add harnessing or support for test automation. This can be a costly up-front effort for any project, and the project cannot enjoy the benefits of CI until this environment is available.
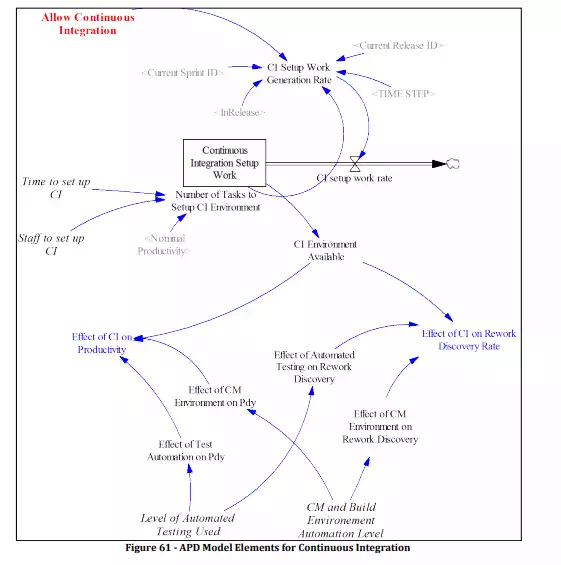
As seen in Figure 61, our APD model captures the upfront cost of CI setup by injecting an amount of tasks into the Continuous Integration Setup Work stock. This is calculated simplistically here by using the formula: Number of Tasks to Setup CI Environment = Nominal Productivity*(Time to set up CI*Staff to set up CI) “Time to Setup CI” and ”Staff to set up CI” both are exogenous model parameters that can be adjusted for simulation purposes. At the beginning of the project, if there is any CI setup work to do, it is the first set of tasks that are transitioned into the Release Backlog.
Also as previously described, Continuous Integration can be broken into two sub practices: Configuration Management (CM), and Test Automation. As shown in Figure 61 CM and Build Environment Automation Level is a lever variable which can be set from 0 to 10 to indicate the level of automation (how much of the process of preparing and building the software for daily development use and especially for release is automated and repeatable.) Level of Automated Testing Used likewise represents how much test automation is in the system; this can range from 0(no automation) to 10 (fully automated unit testing as well as fully automated functional tests – the system can completely self-test as part of a nightly build.)
This allows us to ‘configure’ the Continuous Integration gene depending on the nature and purpose of our simulation to have varying degrees of impact on productivity and rework discovery.
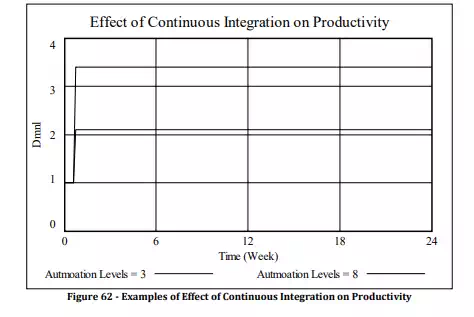
For example, Figure 62 plots two graphs for the Effect of Continuous Integration on Productivity. The solid line is the value of this variable after setting the Level of Automated Testing Used and CM and Build Environment Automation Level parameters both to a value of 3, while the dashed line shows its value after setting them to 8. Simply put, more automation means more productivity, as repetitive manual labour is replaced by software that automated portions of the workflow.