In order to perform “what if” analysis and sensitivity tests on the effects produced from the interaction of gene combinations and management policy variables, we have constructed a “Management Dashboard” that allows us to “pull the levers” on all of our project variables and observe the results (see Figure 66).
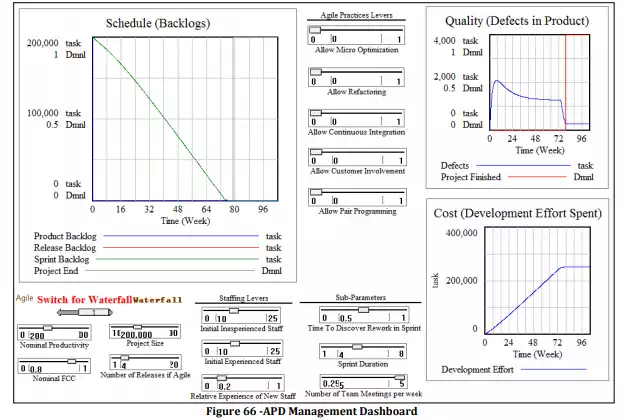
The three project performance graphs that we choose to observe in our dashboard are based on the three sides of the Iron Triangle: Schedule, Cost, and Quality . Schedule completion is determined based on the amount of time it takes for the Product, Release, and Sprint backlogs to be drained to 0. Cost is determined based on the cumulative amount of development effort spent on the project. Quality is determined based on the amount of rework (defects) that are in the product.
Before we begin our experiments, let us set up our base case parameters:
Project Size = 200,000 tasks
Initial Number of Inexperienced Staff = 10 people
Initial Number of Experienced Staff = 10 people
Normal Productivity = 200 tasks per-week, per-person
Using the ‘simplistic’ planning method described previously, we might project a completion time of 50 weeks (Project Size / Staff*Productivity). However, now that we recognize the existence of the rework cycle, and the effects that staff experience mix and staff churn have on the project’s performance, we also set the following parameters:
Nominal Fraction Correct and Complete = 80%
Relative Experience of New Staff = 20%
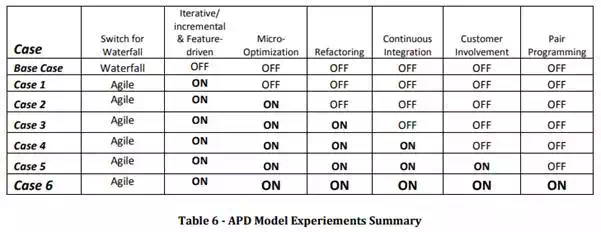
We will hold these parameters constant for the rest of our experiments in order to perform a comparison of waterfall vs. agile given them same external project parameters. We will start with a baseline case of a single-pass waterfall project given these parameters, and we will proceed to “turn on” agile genes one-by-one to observe their cumulative effects of project performance. Table 6 summarizes the set of cases we will cover in the following series of experiments.
For each of our upcoming experiments, we will monitor the results in the form of three project performance variables that gauge performance along the three sides of the Iron Triangle. The first measure, Schedule, gives us an idea of the project duration, i.e. how long it will take to fully complete the project. The second measure, Cost, gives us an idea of the amount of effort that will be expended to complete the project. It is measured as the cumulative amount of effort (in units of “task”) expended on the project. The third and final measure is Quality. We measure quality by monitoring at the total amount of undiscovered rework in the released software across the duration of the project. By “released software” we mean the releases that have been delivered to another organization, be it integration and test teams or the final end-user.
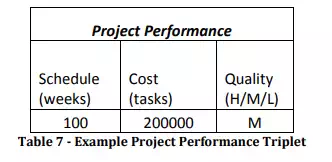
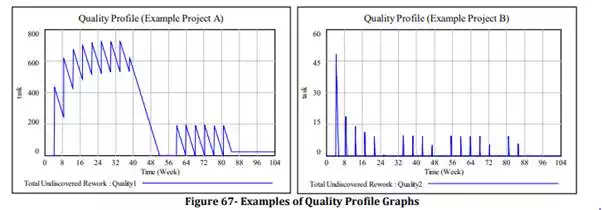
An important thing to keep in mind when observing the Quality measure is that we do not simply look at the number of undiscovered rework tasks in the product, but we give it a rating of “H”, “M”, or “L” (High, Medium, or Low quality) based on the probability that defects are latent in the system at any given point in time. The more undiscovered rework items are in the system, the more likely that a software release will contain a number of these. Since we have not built a mechanism in the model to calculate this, for our purposes we are simply monitoring the “Quality Profile” graph of the project and making a corresponding visual judgment based on the apparent area under the curve. In Figure 67 we show a side-by-side example of quality profile graphs from two different simulations. Roughly, project A has much higher Undiscovered Rework, and over longer periods of time than project B (higher amplitude and frequency) – In this situation we score project A with “L” for low quality and project B with an “H” for high-quality.
Our APD model and set of experiments is not predicting or re-creating results from real projects, but comparing behavior of the project under different scenarios. Different exogenous parameters would produce different results, but here we are holding those exogenous parameters constant to perform a relative comparison of behavior based solely on the selection of Agile genes.