
A probability sampling method is any method of sampling that utilizes some form of random selection. In order to have a random selection method, you must set up some process or procedure that assures that the different units in your population have equal probabilities of being chosen. Humans have long practiced various forms of random selection, such as picking a name out of a hat, or choosing the short straw. These days, we tend to use computers as the mechanism for generating random numbers as the basis for random selection.
Some Definitions
Before I can explain the various probability methods we have to define some basic terms. These are:
v N is the number of cases in the sampling frame
v n is the number of cases in the sample
v NCn = the number of combinations (subsets) of n from N
v f = n/N is the sampling fraction
That’s it. With those terms defined we can begin to define the different probability sampling methods.
Simple Random Sampling
The simplest form of random sampling is called simple random sampling. Pretty tricky, huh? Here’s the quick description of simple random sampling:
v Objective: To select n units out of N such that each NCn has an equal chance of being selected.
v Procedure: Use a table of random numbers, a computer random number generator, or a mechanical device to select the sample.
A somewhat stilted, if accurate, definition. Let’s see if we can make it a little more real.
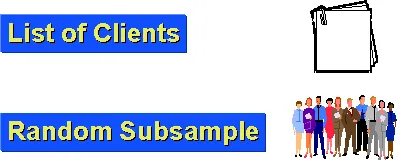
How do we select a simple random sample? Let’s assume that we are doing some research with a small service agency that wishes to assess clients’ views of quality of service over the past year. First, we have to get the sampling frame organized. To accomplish this, we’ll go through agency records to identify every client over the past 12 months. If we’re lucky, the agency has good accurate computerized records and can quickly produce such a list. Then, we have to actually draw the sample. Decide on the number of clients you would like to have in the final sample. For the sake of the example, let’s say you want to select 100 clients to survey and that there were 1000 clients over the past 12 months. Then, the sampling fraction is f = n/N = 100/1000 = .10 (or 10%). Now, to actually draw the sample, you have several options. You could print off the list of 1000 clients, tear then into separate strips, put the strips in a hat, mix them up real good, close your eyes and pull out the first 100. But this mechanical procedure would be tedious and the quality of the sample would depend on how thoroughly you mixed them up and how randomly you reached in. Perhaps a better procedure would be to use the kind of ball machine that is popular with many of the state lotteries. You would need three sets of balls numbered 0 to 9, one set for each of the digits from 000 to 999 (if we select 000 we’ll call that 1000). Number the list of names from 1 to 1000 and then use the ball machine to select the three digits that selects each person. The obvious disadvantage here is that you need to get the ball machines. (Where do they make those things, anyway? Is there a ball machine industry?).
Neither of these mechanical procedures is very feasible and, with the development of inexpensive computers there is a much easier way. Here’s a simple procedure that’s especially useful if you have the names of the clients already on the computer. Many computer programs can generate a series of random numbers. Let’s assume you can copy and paste the list of client names into a column in an EXCEL spreadsheet. Then, in the column right next to it paste the function =RAND() which is EXCEL’s way of putting a random number between 0 and 1 in the cells. Then, sort both columns – the list of names and the random number – by the random numbers. This rearranges the list in random order from the lowest to the highest random number. Then, all you have to do is take the first hundred names in this sorted list. pretty simple. You could probably accomplish the whole thing in under a minute.
Simple random sampling is simple to accomplish and is easy to explain to others. Because simple random sampling is a fair way to select a sample, it is reasonable to generalize the results from the sample back to the population. Simple random sampling is not the most statistically efficient method of sampling and you may, just because of the luck of the draw, not get good representation of subgroups in a population. To deal with these issues, we have to turn to other sampling methods.
Stratified Random Sampling
Stratified Random Sampling, also sometimes called proportional or quota random sampling, involves dividing your population into homogeneous subgroups and then taking a simple random sample in each subgroup. In more formal terms:
Objective:
Divide the population into non-overlapping groups (i.e., strata) N1, N2, N3, … Ni, such that N1 + N2 + N3 + … + Ni = N. Then do a simple random sample of f = n/N in each strata.
There are several major reasons why you might prefer stratified sampling over simple random sampling. First, it assures that you will be able to represent not only the overall population, but also key subgroups of the population, especially small minority groups. If you want to be able to talk about subgroups, this may be the only way to effectively assure you’ll be able to. If the subgroup is extremely small, you can use different sampling fractions (f) within the different strata to randomly over-sample the small group (although you’ll then have to weight the within-group estimates using the sampling fraction whenever you want overall population estimates). When we use the same sampling fraction within strata we are conducting proportionate stratified random sampling. When we use different sampling fractions in the strata, we call this disproportionate stratified random sampling. Second, stratified random sampling will generally have more statistical precision than simple random sampling. This will only be true if the strata or groups are homogeneous. If they are, we expect that the variability within-groups is lower than the variability for the population as a whole. Stratified sampling capitalizes on that fact.
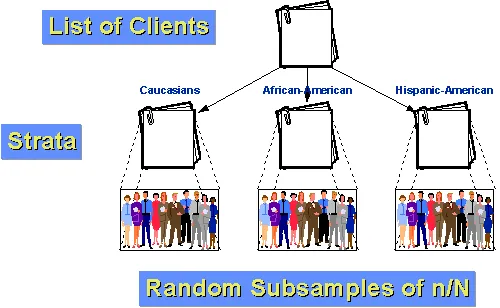
For example, let’s say that the population of clients for our agency can be divided into three groups: Caucasian, African-American and Hispanic-American. Furthermore, let’s assume that both the African-Americans and Hispanic-Americans are relatively small minorities of the clientele (10% and 5% respectively). If we just did a simple random sample of n=100 with a sampling fraction of 10%, we would expect by chance alone that we would only get 10 and 5 persons from each of our two smaller groups. And, by chance, we could get fewer than that! If we stratify, we can do better. First, let’s determine how many people we want to have in each group. Let’s say we still want to take a sample of 100 from the population of 1000 clients over the past year. But we think that in order to say anything about subgroups we will need at least 25 cases in each group. So, let’s sample 50 Caucasians, 25 African-Americans, and 25 Hispanic-Americans. We know that 10% of the population, or 100 clients, are African-American. If we randomly sample 25 of these, we have a within-stratum sampling fraction of 25⁄100 = 25%. Similarly, we know that 5% or 50 clients are Hispanic-American. So our within-stratum sampling fraction will be 25⁄50 = 50%. Finally, by subtraction we know that there are 850 Caucasian clients. Our within-stratum sampling fraction for them is 50⁄850 = about 5.88%. Because the groups are more homogeneous within-group than across the population as a whole, we can expect greater statistical precision (less variance). And, because we stratified, we know we will have enough cases from each group to make meaningful subgroup inferences.
Systematic Random Sampling
Here are the steps you need to follow in order to achieve a systematic random sample:
v number the units in the population from 1 to N
v decide on the n (sample size) that you want or need
v k = N/n = the interval size
v randomly select an integer between 1 to k
v then take every kth unit
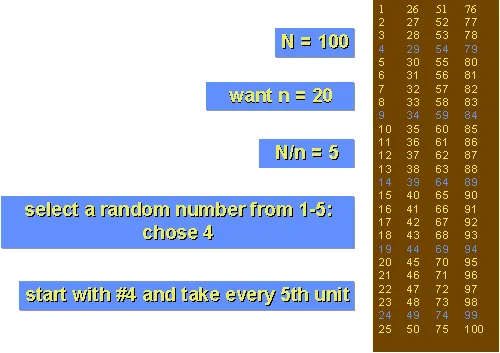
All of this will be much clearer with an example. Let’s assume that we have a population that only has N=100 people in it and that you want to take a sample of n=20. To use systematic sampling, the population must be listed in a random order. The sampling fraction would be f = 20⁄100 = 20%. in this case, the interval size, k, is equal to N/n = 100⁄20 = 5. Now, select a random integer from 1 to 5. In our example, imagine that you chose 4. Now, to select the sample, start with the 4th unit in the list and take every k-th unit (every 5th, because k=5). You would be sampling units 4, 9, 14, 19, and so on to 100 and you would wind up with 20 units in your sample.
For this to work, it is essential that the units in the population are randomly ordered, at least with respect to the characteristics you are measuring. Why would you ever want to use systematic random sampling? For one thing, it is fairly easy to do. You only have to select a single random number to start things off. It may also be more precise than simple random sampling. Finally, in some situations there is simply no easier way to do random sampling. For instance, I once had to do a study that involved sampling from all the books in a library. Once selected, I would have to go to the shelf, locate the book, and record when it last circulated. I knew that I had a fairly good sampling frame in the form of the shelf list (which is a card catalog where the entries are arranged in the order they occur on the shelf). To do a simple random sample, I could have estimated the total number of books and generated random numbers to draw the sample; but how would I find book #74,329 easily if that is the number I selected? I couldn’t very well count the cards until I came to 74,329! Stratifying wouldn’t solve that problem either. For instance, I could have stratified by card catalog drawer and drawn a simple random sample within each drawer. But I’d still be stuck counting cards. Instead, I did a systematic random sample. I estimated the number of books in the entire collection. Let’s imagine it was 100,000. I decided that I wanted to take a sample of 1000 for a sampling fraction of 1000/100,000 = 1%. To get the sampling interval k, I divided N/n = 100,000/1000 = 100. Then I selected a random integer between 1 and 100. Let’s say I got 57.
Next, I did a little side study to determine how thick a thousand cards are in the card catalog (taking into account the varying ages of the cards). Let’s say that on average I found that two cards that were separated by 100 cards were about .75 inches apart in the catalog drawer. That information gave me everything I needed to draw the sample. I counted to the 57th by hand and recorded the book information. Then, I took a compass. (Remember those from your high-school math class? They’re the funny little metal instruments with a sharp pin on one end and a pencil on the other that you used to draw circles in geometry class.) Then I set the compass at .75″, stuck the pin end in at the 57th card and pointed with the pencil end to the next card (approximately 100 books away). In this way, I approximated selecting the 157th, 257th, 357th, and so on. I was able to accomplish the entire selection procedure in very little time using this systematic random sampling approach. I’d probably still be there counting cards if I’d tried another random sampling method. (Okay, so I have no life. I got compensated nicely, I don’t mind saying, for coming up with this scheme.)
Cluster (Area) Random Sampling
The problem with random sampling methods when we have to sample a population that’s disbursed across a wide geographic region is that you will have to cover a lot of ground geographically in order to get to each of the units you sampled. Imagine taking a simple random sample of all the residents of New York State in order to conduct personal interviews. By the luck of the draw you will wind up with respondents who come from all over the state. Your interviewers are going to have a lot of traveling to do. It is for precisely this problem that cluster or area random sampling was invented.
In cluster sampling, we follow these steps:
- divide population into clusters (usually along geographic boundaries)
- randomly sample clusters
- measure all units within sampled clusters
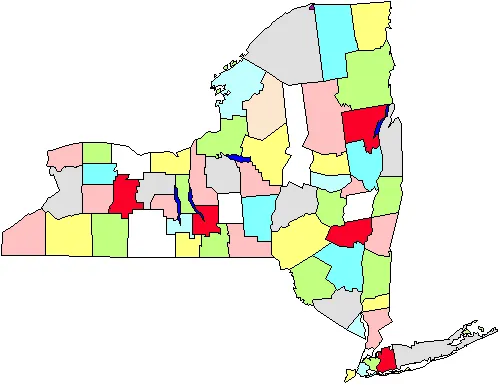
For instance, in the figure we see a map of the counties in New York State. Let’s say that we have to do a survey of town governments that will require us going to the towns personally. If we do a simple random sample state-wide we’ll have to cover the entire state geographically. Instead, we decide to do a cluster sampling of five counties (marked in red in the figure). Once these are selected, we go to every town government in the five areas. Clearly this strategy will help us to economize on our mileage. Cluster or area sampling, then, is useful in situations like this, and is done primarily for efficiency of administration. Note also, that we probably don’t have to worry about using this approach if we are conducting a mail or telephone survey because it doesn’t matter as much (or cost more or raise inefficiency) where we call or send letters to.
Multi-Stage Sampling
The four methods we’ve covered so far – simple, stratified, systematic and cluster – are the simplest random sampling strategies. In most real applied social research, we would use sampling methods that are considerably more complex than these simple variations. The most important principle here is that we can combine the simple methods described earlier in a variety of useful ways that help us address our sampling needs in the most efficient and effective manner possible. When we combine sampling methods, we call this multi-stage sampling.
For example, consider the idea of sampling New York State residents for face-to-face interviews. Clearly we would want to do some type of cluster sampling as the first stage of the process. We might sample townships or census tracts throughout the state. But in cluster sampling we would then go on to measure everyone in the clusters we select. Even if we are sampling census tracts we may not be able to measure everyone who is in the census tract. So, we might set up a stratified sampling process within the clusters. In this case, we would have a two-stage sampling process with stratified samples within cluster samples. Or, consider the problem of sampling students in grade schools. We might begin with a national sample of school districts stratified by economics and educational level. Within selected districts, we might do a simple random sample of schools. Within schools, we might do a simple random sample of classes or grades. And, within classes, we might even do a simple random sample of students. In this case, we have three or four stages in the sampling process and we use both stratified and simple random sampling. By combining different sampling methods we are able to achieve a rich variety of probabilistic sampling methods that can be used in a wide range of social research contexts.