
Statistical analysis is a very important aspect of quality systems. It could be considered a cornerstone of the quality improvement process and is very closely tied to auditing a quality system, which is discussed later in the chapter. Statistical process control (SPC) was what Duran taught as a decision maker in quality systems. Statistical analysis is the measurement portion of quality systems and allows it to be managed. A very common saying in management, which relates well to quality, is “you cannot manage what you cannot measure,” and statistical analysis will give you the measurements necessary to make management decisions.
Statistics was a key tool that Deming used to distinguish between systemic and special causes, and the key to quality management in general was statistical process control. SPC was developed by Walter Shewart while working at Bell Labs in the 1930s, and Deming took Shewart’s concept and applied it to quality management. Deming believed that SPC was necessary because variation is a fact of life in any process. Deming believed that it was very unlikely that two products/services when produced by the same procedure and operator would be identical.
Control Charts and Their Role in Quality Systems.
Control charts are the most widely used tool in quality systems. Control charts communicate a lot of information effectively. Figure 14.2 shows a process in which all the outcomes are within the specified limits. The upper control limit (UCL) is .18 and the lower control limit (LCL) is .02, and all the points fall between these two limits. This means the process is in control and operating correctly. If some of the points were to fall outside of the UCL or LCL, it would signal that the process is not in control and action needs to be taken to correct the problem.
We discussed earlier the two different types of errors, (1) systematic and (2) special causes. Systematic errors will show up on a control chart as one or two points outside of the control limits with the rest of
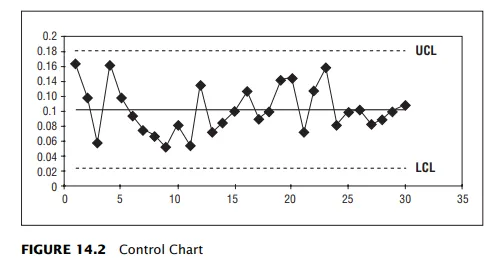
the points within the limits. Special causes will show up on a control chart with numerous points outside of the control limits.
The exact use of statistical measures is going to be different for each organization. Some statistical analysis will be very easy to set up and use. For example, the length or weight of a particular part can be measured and analysis can show if the parts are within the required specifications. In service industries the statistical analysis will be more abstract, but is just as valuable. For example, one could survey customers regularly and ask them on a scale of 1 to 10, “How would you rate the service?”
Here are some common traits of statistical measures used in quality systems:
✔ Are driven by the customer.
✔ Reflect vision and values.
✔ Benchmarked to the competition.
✔ Are achievable.