The analysis of failures is very important for revealing the cause of a particular failure, for taking appropriate measures to avoid similar failures in the future, and for improving similar products or processes. Historically, failure analysis has also contributed to the creation of new disciplines of mechanics and other branches, and to the better design and reliability of many products. Two basic kinds of failure analysis can be distinguished: analysis of individual failures and statistical analysis. However, failures can also be sorted according to other criteria.
Analysis of individual failures
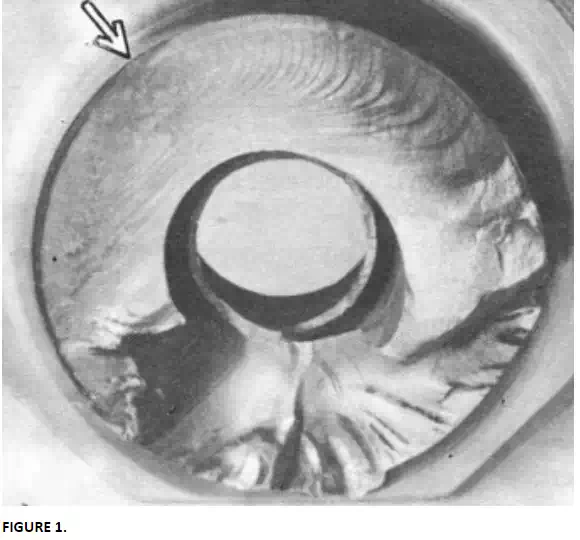
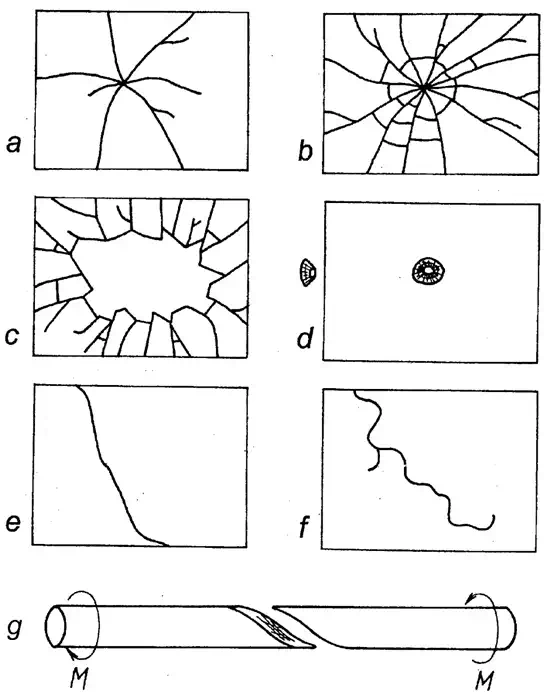
This kind of analysis aims at finding the cause of particular failures. Generally, it has three sources: appearance of the failed object, history of the accident, and information on the loads, material properties, and conditions of the service or operation. An observation of the appearance of the failed item can often reveal the fracture origin (Figs. 1 and 2) and the internal cause of the failure (e.g. a material defect). Fracture mechanics can help in the determination of the magnitude of stresses and forces acting at the critical place at the instant of fracture. The appearance of the fracture surface (Fig. 1) and the crack trajectory (Fig. 2) can inform about the time course of the fracture process and also about the characteristic failure mode (brittle fracture or fatigue fracture) and the kinds of acting stresses (e.g. shear stress leading to torsion fracture; Fig. 2g). Some details are visible with the naked eye, and some need an electron microscope. It is important to create a detailed photographic documentation or, at least, a thorough description of the failed object.
Failure analysis uses the time course of the accident and the situation before it, the detailed history of operation, and the conditions of use of the object. The analysis can lean on records from operation (time course of pressures, temperatures, other loads acting on the object, the conditions of environment and the personnel). The sources are records of measuring devices, logbooks, and protocols from inspections. Often, a computer analysis of the stresses acting in the object is done or also the analysis of material properties, including the mechanical testing of specimens taken out from the critical parts (tensile test, fatigue tests, test of notch resistance or fracture toughness, etc.). Generally, this kind of analysis can result in measures for the prevention of similar failures in similar components or structures in the future. Well-known are extensive (and expensive) analyses done after aircraft accidents, but thorough analyses became common after every accident with critical consequences. Some rules for failure analysis are also summarized in [1, 2]. Examples of many failures and their analysis can be found in the literature [2 – 6]. Interesting also is the TV series “Seconds from disaster” or the analyses of aircraft accidents observable via YouTube.
Statistical failure analysis
This kind of analysis works with a high number of failures of certain kind (e.g. failures of bridges, gear boxes or buildings, as well as vehicle collisions in the analysis of traffic accidents, interruptions of electricity supply, or death cases in a hospital). It uses the records on accidents and failures and records from service stations or repair workshops. The failures can be sorted according to various criteria, such as the kind of the failed object, the place or time of the occurrence, or the cause. Statistical analysis needs a high number of values and the knowledge of statistical methods. Useful is the software able to sort the data according to various criteria and to perform statistical tests. It enables one to distinguish rare failures from systematic ones and helps in finding the common cause of some failures. Compared to the analysis of individual failures, statistical analysis can reveal hidden relations and reasons for some kinds of failures. As a consequence, it can help to introduce system measures for reliability enhancement, such as 100% control of welds or bought components, introduction of certain regulations, such as the demand for special qualification for some kinds of work, fire regulations, standards for building of metallic structures, prohibition of building in the area endangered by flooding or avalanches, or prescription of preventive inspections in health care.
Sorting of failures
Failures can be sorted according to various criteria. Understanding the character and cause of a particular failure helps in deciding what means should be used to avoid such failures in the future or to reduce their consequences. In this paragraph, sorting according to the character of failures is shown first followed by sorting according to various criteria.
A failure can be:
· sudden or gradual,
· random or systematic,
· insignificant or significant,
· independent or dependent.
The inclusion of the investigated failure into the proper group facilitates the selection of an appropriate strategy for avoiding similar failures in the future. Failures can further be sorted according to
· seriousness of consequences,
· frequency of occurrence,
· time (duration) of operation failure,
· time (date) of occurrence,
· period in the lifetime,
· location of occurrence,
· cause,
· failure mechanism,
· other criteria.
The individual criteria are discussed further in detail.
Kind of the object (component or appliance). In civil or mechanical engineering, it is usual to record, study, and analyze the failures of bridges, gear boxes, fans or pumps of certain kind; failures of traction rail vehicles, cars or airplanes of brand “xxx“ or type ”yyy“, failures of brakes, failures of electric or hydraulic appliances, etc. In medicine, one can observe and investigate diseases (or deaths) of children or adults, some kind of disease, etc. In traffic, accidents of certain vehicles, such as buses, motorcycles, or trucks, can be studied. This topic will also be addressed at the end of this chapter.
Severity and frequency of occurrence. Failures can be sorted according to the consequences (e.g. “insignificant – minor – mean – serious – critical – fatal“). (Other classifications are possible as well.) The significance of a certain kind of failures can be evaluated similarly to the FMEA analysis, as explained in Chapter 12. In addition to the severity of a particular kind of failure, it is also possible to consider its frequency or probability of occurrence (“how often it happens?”), to assign weights to them, and to form a common criterion “consequences × frequency“. Generally, and for civil engineering structures in particular, it is reasonable to distinguish the failures of serviceability and the failures of load-carrying capacity.
Time of operation until failure. This quantity can be measured in hours or seconds, kilometers, number of pieces processed until the cutting tool becomes blunt, etc. The distribution of a large amount of these values, plotted along the time axis, enables one to distinguish early failures and wear-out failures, etc. It is also important for the determination of basic reliability characteristics, such as MTTF and MTBF, or for planning maintenance and renewal.
Time of occurrence. The occurrence of failures can sometimes depend on time [e.g. on the daytime (hour), year season (influence of weather), or even the day in a week]. For example, many years ago, the ironic term “Monday car“ was used in the United States because of a much higher failure rate of cars assembled on that day, perhaps the aftermath of the weekend.
Stage in the lifetime of the object. Generally, three stages exist, where failure occurs or can be initiated:
1. Concept proposal and preparation of manufacture or building.
2. Manufacture, assembly, or building.
3. Operation of the component, object, or appliance.
The individual stages can become sources of different causes and kinds of failures (e.g. ”child diseases“ appearing soon after putting the object into operation or failures due to wear and aging after a long time of service). The knowledge of the typical features of failures in the individual stages helps in the choice of a proper strategy for improvement.
Place of origin. Three examples can be given: the fifth mould in a multisectional machine for glass bottle-making, various parts of a road in the case of traffic accidents, or the operator who has the highest rate of failures. The knowledge of the place where the failures occur most often helps one to better identify the reason for the failures. Also, it reduces the time necessary for repair. Failure cause. Basically, the cause of a failure can be internal or external. An internal cause means that the component was ”weak“ for the assumed load. Such failures can be avoided by better design, dimensioning, or manufacture. Failures due to external cause are those caused by overloading, collision with another object or due to another failure. The efficient way to mitigate them needs the knowledge of failure cause in the particular case.
Principal causes of failures
1. Natural influences or disasters (also collision with another object);
2. Unpredictable, random, or insufficiently known influences (e.g. load, environment);
3. Deficient project (errors in the concept, dimensioning, choice of materials, etc.);
4. Defective material or semifinished goods and bought components;
5. Unsuitable process of the manufacture, assembly, or building;
6. Disobeying the prescribed conditions for manufacturing (the proper material) or operation (e.g. overloading);
7. Insufficient control and verification tests;
8. Wear, fatigue, change of dimensions or properties of the object in time;
9. Insufficient maintenance;
Human factor:
· Ignorance, insufficient knowledge;
· Negligence, disorderliness, laziness, carelessness;
· Errors, inattention, absent-mindedness, bad psychical condition;
· Unsubstantiated reliance in other people;
· Excessive thriftiness, greed;
· Malicious intention.
Mechanisms and causes of mechanical failures
· ductile (with well observable permanent deformations; it occurs due to the overloading of components from tough materials);
· brittle (without observable permanent deformations; it occurs in brittle materials, at low temperatures, dynamic load, impact, notches, cracks);
· fatigue [with typical appearance (Fig. 1); it occurs under harmonic or periodic loading or even under constant load];
1. Strength reduction due to cracks;
2. Wear (adhesive, abrasive, erosive, fatigue, and cavitation);
3. Corrosion (chemical, electrochemical, oxidation, and erosion of electric contacts);
4. Permanent deformations (by overloading);
5. Permanent deformations in the surface layer due to high contact stresses;
6. Gradual changes in shape and dimensions due to creep (in some materials even under normal temperatures);
7. Temporal property changes due to changes in the environment (temperature, humidity…);
8. Material changes due to UV radiation or ozone (aging of polymers and rubber);
9. Chemical changes promoted by diffusion (e.g. carbonation of concrete by CO2);
10.Changes of dimensions and dynamic properties due to the loss of material (corrosion or abrasion) or its gain (ice accretion, water-logging, deposition of products of chemical reactions);
11.Changes caused by living organisms (rodents, insects, fungi, mould, rotting).
Also other criteria for sorting can be used. The high number of available failure data enables their sorting and analysis according to several criteria simultaneously. Such analysis can reveal relationships and influences unknown as yet.
Classification of failures
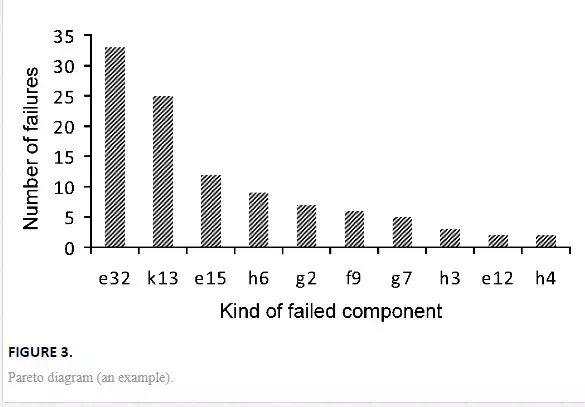
Especially two aspects of failures are important: severity and frequency or probability of occurrence. In the case of a high number of various kinds of failures, a Pareto analysis is very informative. In this analysis, kinds of failures are rank-ordered according to the frequency of occurrence. The pertinent histogram shows at first sight the failures that occur most often and the rare ones (Fig. 3). The typical shape of a Pareto diagram has led to the saying “20% of all causes are responsible for 80% of all troubles, and 80% of causes are responsible for 20% of problems“. However, this is only a saying and not a law of nature.
Also, the knowledge of relative frequencies of occurrence, corresponding to probabilities, is important. One should keep in mind that a product with 100 failures per 1million pieces is much more reliable than another product with ”only“ 10 failures, but per 1000 pieces. The significance of failures can be evaluated according to the consequences and to the frequency of occurrence. The overall importance is evaluated with respect to both criteria, as described in the “Severity and frequency of occurrence” paragraph and in Chapter 12.
Computer-aided failure analysis and record keeping
Many items today are very complex and can fail from various reasons. Manufacturers or users of products such as cars, locomotives, pumps, etc., often produce or operate many pieces, so that the number of various failures can be very high. A consequent reliability analysis needs a system for the classification of failures (and also a system for the evidence of times between failures and times to repair, a system for data collection, and tools for statistical data analysis). Here, a simple system for the classification of failures in railway driving vehicles [7] will be shown as an example. This system classifies the failures with respect to the (1) kind of vehicle, (2) structural group in the vehicle, (3) subassemblies, and (4) specification of the failure. Each of these four categories is again divided into several subcategories. The code for each failure thus represents a four-digit number of the form ABCD, whose digits specify the situation in the individual subcategories, for example:
A. Kinds of railway vehicles
1 – Electric locomotives for DC
2 – Electric locomotives for AC…
7 – Diesel locomotives…
B. Structural groups in railway vehicles
1 – Bogie
2 – Body
3 – Mechanical equipment…
8 – Protective paints, signs, labeling…
C. Subassemblies
The number here characterizes the specific properties of individual groups, typical for some kinds of vehicles, purpose, and kind of use (feeding, power transmission, shifting, etc.). The number of subassemblies can be different in individual groups.
D. Specification of failures with respect to the consequences
0 – Component without failure
1 – Repair of faulty or damaged component
2 – Exchange of faulty or damaged component
For example, the code 2312 in the above “ABCD” system means electric locomotive for alternating current (2), failure of mechanical equipment (3) at traction part (1), and the pertinent component had to be replaced by a new one (2). Various systems exist (also as a part of maintenance management systems) or can be created according to the specific requirements of the user (e.g. a system for evidence and the classification of failures combined with the tools for cost analysis).