
Having been in the project management, training and coaching for over last many years, I witnessed that- The histogram is one of the powerful Quality planning and control tool to understand preventive and corrective actions. In a given situation, it shows the different causes of problems. It reflects these frequencies in tabulated adjacent rectangles. The height of the bar or adjacent rectangles analysed further to discover corrective or preventive actions.
A specific form of bar chart used to represent the central tendency, dispersion, and pattern of a statistical distribution
Let’s look at a case study for the Development of Histogram as Quality Control Example:
To make a histogram, we need a check sheet as an input. To get more details about check sheet, please refer to the Blog Check Sheet as a Component of Seven Basic Quality Tool;
As a reference, I am using the same example used in check sheet:
Let’s reiterate the same example used in the check sheet –
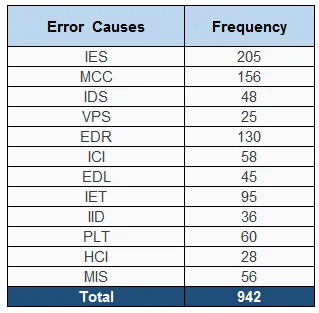
While examination the work product, test team member assesses the defects and enter frequencies in their respective category of causes like:
Check Sheet suggested by roger s. pressman in software engineering a practitioner’s approach
As a further explanation, first two columns are used to develop a Histogram, as shown below:

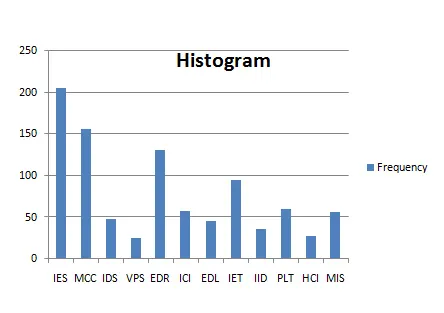
As mentioned below, using excel we can develop Histogram,
Usage of histogram:
Let’s see usage of Histogram in context of “Plan Quality Management” and “Control Quality” for your The Project Management Professional (PMP)® examination.
· In “Plan Quality Management” a Histogram serves as a preventive approach to improve processes. We use historical data to identify categories of causes effecting most. Based on effecting most categories, we select processes to improve. For example due to higher frequencies in IES, MCC and EDR, we may select improvements in “Collect Requirement”, and “Define Scope” processes.
· Using “Control Quality” we identify causes of poor performance help in improving processes and their work products. In this way, causes of poor performance analysis make Histogram a powerful tool to take corrective actions.
Difference between Pareto Chart and Histogram:
| Histogram | Pareto Chart |
| The Histogram is a kind of bar chart showing a distribution of variables or causes of problems. | A Pareto chart is a specific type of histogram that represents the causes of problems by their influence. It is a useful tool to prioritize corrective action as errors with the greatest impact displayed in descending order of frequency. |
| A histogram represents cause of a problem as a column and the frequency of each cause of problem as the height of the column. | In Pareto chat, an arc representing the cumulative percentage of frequencies of causes also included. |
In short, A histogram is a bar chart especially in TQM. It shows the frequency of a cause of a problem occurring where the height of the bar as an indicator of the most affecting reason.
The histogram is one of seven basic quality tool; you can watch and listen to the live video presentation on Seven QC tools here: