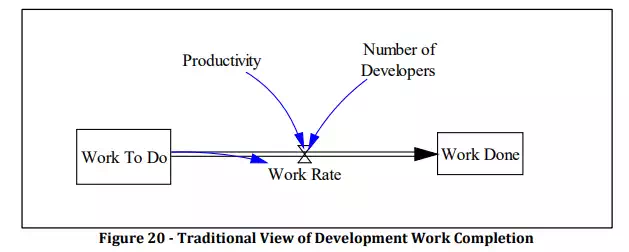
The conventional view of a project is as a collection of predefined tasks. Based on a predetermined work rate (number of tasks that can be accomplished by the project team per unit of time,) the project manager can project an estimate of how long it takes to complete development. Figure 20 shows the SD representation of a project model based on these assumptions, using stocks and rates as follows:
· Work To Do: The amount of work to be performed.
· Work Done: The amount of work completed.
· Productivity: The amount of work that can be done per-developer, per unit of time.
· Number of Developers: The number of developers available.
· Work Rate: The rate at which Work To Do is drained, and at which Work Done accumulates. It is the product of Productivity by Number of Developers.
If we execute this model with the following initial values:
· Work To Do = 8000 Source Lines of Code (SLOC)
· Productivity = 160 SLOC per Month, per person
· Number of Developers = 10 people
Then our Work Rate will be a steady 1600 SLOC per month, and the project will take five months to complete (the time at which the level of Work To Do reaches zero), as shown in the Figure 21 simulation results from executing this model.
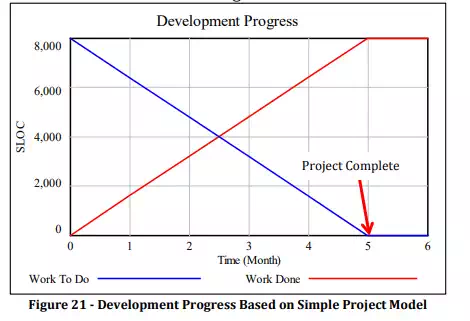
However, it is clear that this model is overly simplistic. It does not take into account the fact that Work To Do is constantly changing, not only decreasing because of work being completed, but also fluctuating because defects, errors, and other forms of “rework” are generated during development.
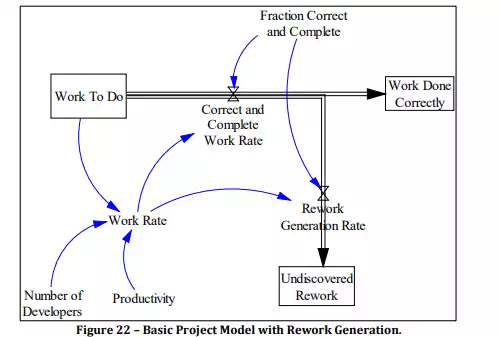
Evolving this model to add in the concept of rework yields the following version of the model in Figure 22, where a Fraction Correct and Complete (FCC) dictates the percentage of completed work that is correct and defect-free, ending up in the stock of Work Done Correctly. The remainder of the work is either incorrect or incomplete and requires rework, and thus makes it into the Undiscovered Rework stock.
Continuing with our example, assuming an FCC of 80%, we find that 1600 additional SLOC worth of rework have been introduced into the system by the fifth month, as shown in the graph in Figure 23, generated by executing this revision of the model.
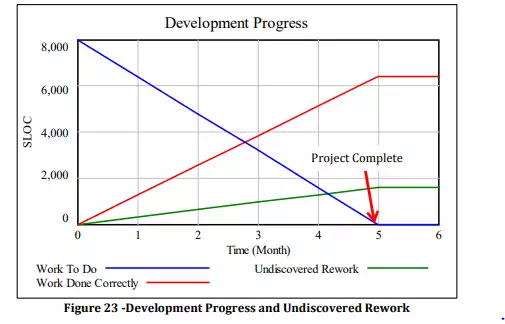
Note that the project is considered complete when Work To Do reaches zero at month five. However we also observe that at month five, there are yet 1600 SLOC in Undiscovered Rework. In other words, 20% of the completed work needs to be re-worked, but the project team is not yet aware of this. It is also important to note that while rework remains undiscovered, project management can overestimate progress, thinking that by month 5 the project will be complete.
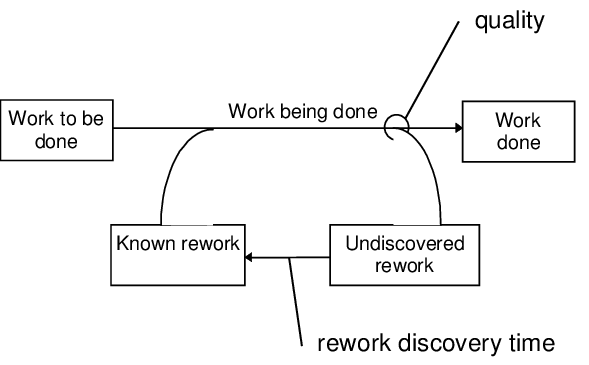
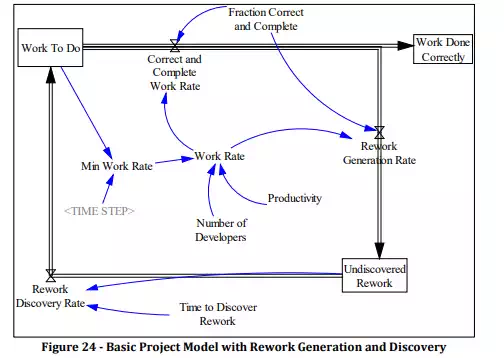
In real projects however, rework is discovered at various stages through validation and verification – Let us further refine this model to introduce an element of rework discovery. As code is inspected, tested, integrated, deployed, etc. rework is discovered and added to the collection of Work To Do. Figure 24 shows the model revised to add rework discovery, assuming a nominal Time to Discover Rework of one month.
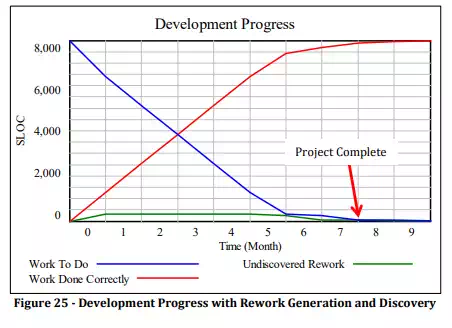
This completes a simplified model of the classic “Rework Cycle”. Due to the rework effects, a project that was planned to complete in five months now takes up to ten months, as shown in the output graph in Figure 25. This in part explains the “90%” phenomena: often, as a project nears its end, it seems to be stuck at “90% complete” for a long time, without apparent progress. The “90% syndrome” is due to the effect of rework discovery: especially at the tail-end of a Waterfall project where system level testing and integration activities ramp up and begin to identify defects and rework. In our example, our project is stuck at 90% from months 6 to 10. As software components are completed and integrated, interface problems are identified, as well as user/customer related issues when the final product is first presented to them.
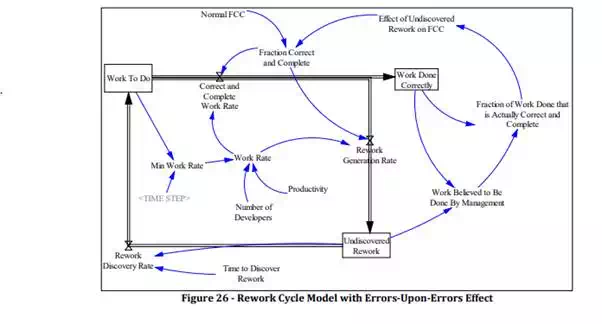
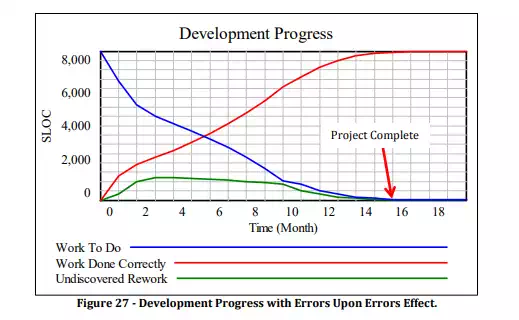
Additionally, as rework and defects remain undiscovered in the system, new development work built on top of these may end up needing rework as well. We call this the “Errors upon Errors” effect: A second order feedback describing the compounding nature of undiscovered rework, as shown in Figure 26. The more undiscovered rework in the project, the more likely that new work built on top of it will require rework as well. In our example, when adding this loop even more rework is generated, and now the project takes about 16 months to complete (see Figure 27)!
In the field of Strategic Project Management, the rework cycle is seen as being at the root of the dynamics behind project performance. Errors and undiscovered rework lead to more work in the form of further cycles (iterations) which are unplanned. Traditionally, project managers deal with this situation by adding a “buffer” to the project in the planning phase, either in the form of a schedule buffer (such as practiced in Critical Chain Path Management) or a cost buffer (e.g. the ‘management reserve’ in EVM) to fund extra staffing or overtime effort.
The clear messages from the rework cycle are (1) improve fraction correct and complete (do it right the first time); (2) discover rework as soon as possible (avoid the “errors upon errors” effect); and (3) incorporate estimates of undiscovered rework in project status. (de Weck & J. Lyneis 2011) Fine-tuned System Dynamics models can be used to estimate the potential impact of rework in projects and plan accordingly