R-squared measures the proportion of the variation in your dependent variable (Y) explained by your independent variables (X) for a linear regression model. Adjusted R-squared adjusts the statistic based on the number of independent variables in the model.R2R2 shows how well terms (data points) fit a curve or line. Adjusted R2R2 also indicates how well terms fit a curve or line, but adjusts for the number of terms in a model. If you add more and more useless variables to a model, adjusted r-squared will decrease. If you add more useful variables, adjusted r-squared will increase.
Adjusted R2adjRadj2 will always be less than or equal to R2R2. You only need R2R2when working with samples. In other words, R2R2 isn’t necessary when you have data from an entire population.
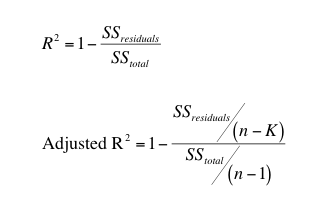
Formula
R2adj=1−[(1−R2)(n−1)n−k−1]Radj2=1−[(1−R2)(n−1)n−k−1]
Where −
· nn = the number of points in your data sample.
· kk = the number of independent regressors, i.e. the number of variables in your model, excluding the constant.
Example
Problem Statement:
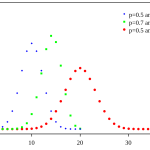
A fund has a sample R-squared value close to 0.5 and it is doubtlessly offering higher risk adjusted returns with the sample size of 50 for 5 predictors. Find Adjusted R square value.
Solution:
Sample size = 50 Number of predictor = 5 Sample R – square = 0.5.Substitute the qualities in the equation,
R2adj=1−[(1−0.52)(50−1)50−5−1]=1−(0.75)×4944,=1−0.8352,=0.1648