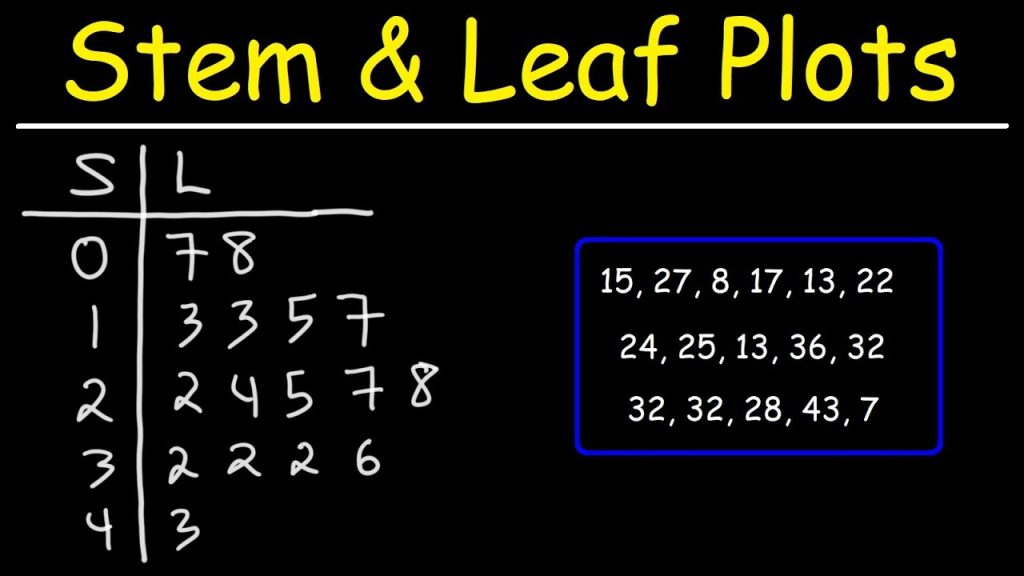
Stemplots are similar to histogram with the difference that in histogram, bars are used to compare data and in case of stemplots leaves represents actual numbers to be compared. Stemplots are also called stem and leaves plot as there is one step with largest place value digits on the left and at leaf(ves) to the right. A Stemplot is used to draw quantitative data with fewer than 50 observations.
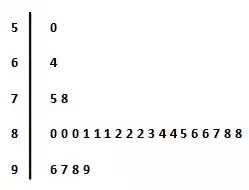
In a stemplot, left side entries are called stems; and the right side entries are called leaves. In figure above, the stems are tens (here 5 represents 50, 6 represents 60, and so on); and the leaves are actual values. Stems and leaves may be labelled as – millions, thousands, ones, tenths, etc.
Example
Problem Statement:
Draw Stemplot diagram for the following data points.
| 64 | 82 | 85 | 99 | 96 | 81 | 97 | 80 | 81 | 80 | 84 | 87 | 98 | 75 | 86 | 88 | 82 | 78 | 81 | 86 | 80 | 50 | 84 | 88 | 83 | 82 |
Solution:
Step 1 – Sort the numbers in ascending order.
| 50 | 64 | 75 | 78 | 80 | 80 | 80 | 81 | 81 | 81 | 82 | 82 | 82 | 83 | 84 | 84 | 85 | 86 | 86 | 87 | 88 | 88 | 96 | 97 | 98 | 99 |
Step 2 – Choose step as largest place value. In our case it is 10. So each step will represent 10 units.
Step 3 – Group the numbers based on stem value.
| 50 | |||||||||||||||||
| 64 | |||||||||||||||||
| 75 | 78 | ||||||||||||||||
| 80 | 80 | 80 | 81 | 81 | 81 | 82 | 82 | 82 | 83 | 84 | 84 | 85 | 86 | 86 | 87 | 88 | 88 |
| 96 | 97 | 98 | 99 |
Step 4 – Draw the stem numbers as 10’s place-value digits 5, 6, 7, 8 and 9 (each number is representing 10 units). Draw the leaves as 1’s place value.