A bar chart is a graphical representation of the categories as bars. Each bar’s height is proportional to the quantity of the category that it represents. A bar chart can be plotted vertically or horizontally. Usually it is drawn vertically where x-axis represents the categories and y-axis represents the values for these categories.
Problem Statement:
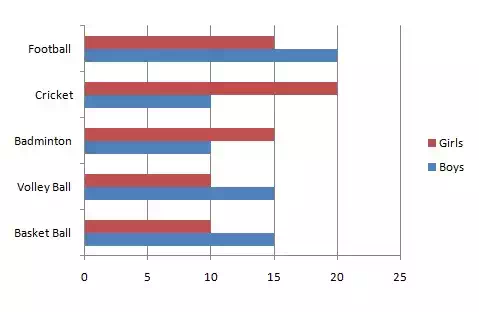
Create a bar chart that illustrates the various sports played by the boys and girls in a society.
| Sr. No. | Sport | Boys | Girls |
| 1 | Basket Ball | 15 | 10 |
| 2 | Volley Ball | 15 | 10 |
| 3 | Badminton | 10 | 15 |
| 4 | Cricket | 10 | 20 |
| 5 | Football | 20 | 15 |
Solution:
Use the x-axis to draw the boys and girls data and use y-axis to draw the category as sports. Draw the chart as shown below: