Financial statements are without a doubt the most important resource for any individual investor. All companies with stock trading on the New York Stock Exchange, the American Stock Exchange, Nasdaq, etc. are required to file financial statements with the Securities and Exchange Commission (SEC) single quarter. All that information is available to you, free of charge. So now we’ll show you how to use it. Think of financial statements as a company’s medical charts, and you’re the doctor who’s using these charts to come up with a diagnosis of the company’s financial health.
Here are the “Big Three” financial statements:
1) The balance sheet
The balance sheet is a snapshot of a company’s financial position. The balance sheet reveals a firm’s financial resources (their assets) and obligations (their liabilities) at a given moment in time.
2) The income statement
The income statement summarizes a firm’s financial transactions over a defined period of time, whether it’s a quarter or a whole year. The income statement shows you money coming in (revenues, also known as sales) versus the expenses tied to generating those revenues.
3) The cash flow statement
A company’s sole reason for existing is to generate cash that can be distributed to shareholders. This dynamic is called a “positive cash flow.” As we’ll explain a little later, cash flow is not the same as income, and it’s important to know the difference.
The Balance Sheet
The Balance Sheet
The balance sheet is broken into two sides. Assets are on the left side (or the top, in the example below) and liabilities and shareholder equity are on the right side (or the bottom). The balance sheet is said to be “in balance” when the value of the assets equals the combined value of the liabilities and shareholders’ equity (by the way, a balance sheet always has to be balanced).
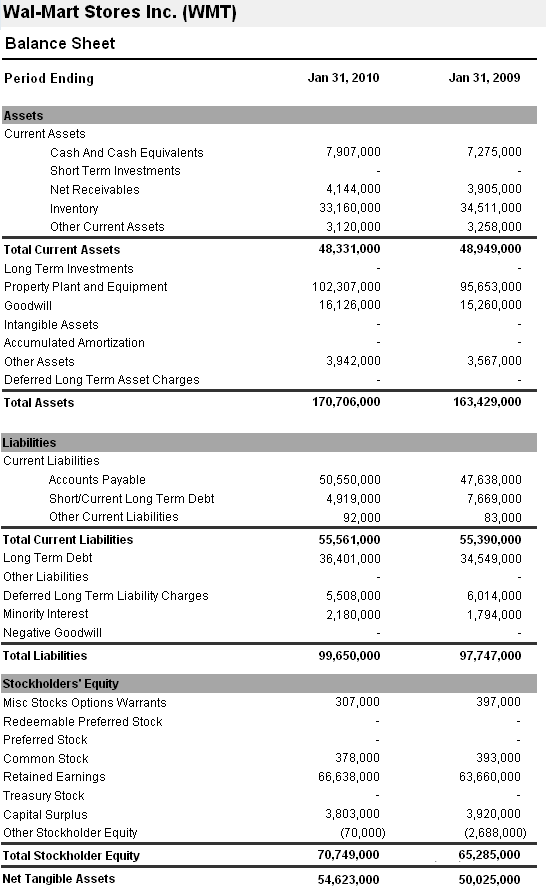
Let’s look at Walmart’s balance sheet, as shown on Yahoo Finance:

The balance sheet’s underlying equation is Assets = Liabilities + Shareholders’ Equity. In other words, a company raises money through debt (liabilities) and/or contributions from owners (equity) and uses it to buy assets. A company’s assets then make the products or services that the company sells to customers.
Here are some of the most important things to look for:
Current Assets: Current assets can be easily turned into cash, because they have a lifespan of 12 months or less. These short-term assets include accounts receivable, inventory, cash, and cash equivalents. Cash equivalents are extremely safe assets, like U.S. Treasuries, that can be easily transformed into cash.
Property Plant & Equipment (PP&E): PP&E is often the largest line item on a firm’s balance sheet. That makes sense, considering that many companies make huge investments in things like factories, computer equipment and machinery.
Intangible Assets: An intangible asset is something without a physical substance. Examples include trademarks, copyrights and patents.
Goodwill: Goodwill is an accounting construct that’s a little confusing to explain and is probably beyond the scope of a beginner’s tutorial. But in short, when a company buys another company, and it pays more than the fair value of the assets it buys, the excess purchase price is listed on the acquiring company’s balance sheet as goodwill. Goodwill can’t be bought or sold, so many analysts prefer to not consider it when they are examining a firm’s assets.
Current liabilities: These are debts that must be paid within 12 months. They include both short-term borrowings, such as accounts payables, and the current payment on long-term debt.
Long-term Debt: Long-term debts are due in one year or more. A company records the market value of its long-term debt on the balance sheet, which is the amount necessary to pay off the debt.
Shareholder equity: Also known as stockholder equity, shareholder equity represents the portion of the company that belongs to its owners. Equity can be increased by reinvesting profits or by paying down debt.
The Income Statement
With a greater understanding of the balance sheet and how it is constructed, we can now look at the income statement.
The basic equation underlying the income statement is Revenue – Expense = Net Income.
The equation is simple, but the terminology can be convoluted.
The income statement is also known as a “profit & loss statement”, or a “P&L.” Revenue is also know as “sales,” and is also called “the top line.” Net income is also known as “earnings” and “profit,” in addition to being called “the bottom line.” Clear as mud, right?
But I promise if you take some time to get comfortable with the vocabulary, the income statement willreveal some remarkable information. Again, let’s take a look at Walmart’s income statement, as reported on Yahoo Finance:

Here are some of the most important things to look for:
Total Revenue: If you compare total revenue from one year (or quarter) to the next, you should be able to see patterns. Are revenues growing? Are they shrinking? A company needs to sell its product in order to stay in business, and this is where you can see that process in action.
Gross profit: Gross profit is the difference between sales price and the cost of producing the products. If this is negative, the company is in real trouble.
Operating Expenses: Operating expenses are costs that a company must pay in the normal course of business. A company needs to pay employees, research & develop new products, pay rent, and so on.
Operating Profit: Operating Profit = Operating Revenue – Operating Expenses. Operating profits are earned from a company’s everyday core business operations. Operating profits also are called “Earnings Before Interest and Taxes (EBIT).”
Net Income: Net income is always found toward the bottom of the income statement (hence, the bottom line), and it’s the most-watched number of any in finance. Let’s look back at the equation we introduced earlier: Revenue – Expense = Net Income. Net income is, in theory, the amount of sales that are left over to be distributed to shareholders.
To take your examination of the income statement a step further, you need to measure all of these line items in relation to one another. That’s called “margin analysis.” You can learn more about it here: How to Use Margin Analysis as an Investment Tool.
The Cash Flow Statement
The cash flow statement is probably the most misunderstood, but most important of the financial reports filed by companies. Have you ever heard the phrase, “Cash Is King?” Many value investors base all of their decisions on how well a company can generate cash.
The cash flow statement reports a company’s cash receipts and cash payments over a particular period of time. It leaves out transactions that don’t directly affect cash receipts and payments.
For example, the income statement includes a non-cash expense called depreciation. Depreciation is a term made up by accountants — it’s not a person or a place to which a company can write a check for “depreciation” expenses. The income statement accounts for non-cash expenses, and the cash flow statement undoes that accounting so investors can see exactly where the company generates (and uses) all its cash.
The cash flow statement divides up sources and uses of cash into these three areas: financing, operating and investing. Let’s look at Walmart again:

Now let’s take a closer look at those 3 main categories:
Cash Flow from Operations (CFO): CFO is the cash generated by the company’s core business activities. You want a company to generate cash from the business it operates. It sounds obvious, but there are a ton of companies that don’t generate cash from operations and eventually fail.
Cash Flow from Investing (CFI): Remember the Property Plant & Equipment line from the balance sheet? When a company invests in these long-lived assets (or sells them), the cash they spend buying the asset or the cash they generate from selling the asset is recorded here. If a company is growing, CFI will almost always be negative. That’s a good thing, because it means the company is investing in assets that will create profits for shareholders.
Cash Flow from Financing (CFF): CFF is the cash that is provided by or repaid to outside investors. If a company borrows $1 million, that is $1 million dollars that flows into the company, and CFF is positive. When the company repays the $1 million, that is a $1 million outflow of cash, and CFF is negative.
There’s a lot more to learn about the beauty of cash flows, so click here to read the 10 Things to Know about Every Cash Flow Statement.

