Data patterns are very useful when they are drawn graphically. Data patterns commonly described in terms of features like center, spread, shape, and other unusual properties. Other special descriptive labels are symmetric, bell-shaped, skewed, etc.
Center
The center of a distribution, graphically, is located at the median of the distribution. Such a graphic chart displays that almost half of the observations are on either side. Height of each column indicates the frequency of observations.

Spread
The spread of a distribution refers to the variation of the data. If the set of observation covers a wide range, the spread is larger. If the observations are centeredaround a single value, then the spread is smaller.

Shape
The shape of a distribution can described using following characteristics.
· Symmetry – In symmetric distribution, graph can be divided at the center in such a way that each half is a mirror image of the other.

· Number of peaks. – Distributions with one or multiple peaks. Distribution with one clear peak is known as unimodal, and distribution with two clear peaks is called bimodal. A single peak symmetric distribution at the center, is referred to as bell-shaped.

· Skewness – Some distributions may have multiple observations on one side of the graph than the other side. Distributions having fewer observations towards lower values are said to be skewed right; and distributions with fewer observations towards lower values are said to be skewed left.

· Uniform – When the set of observations has no peak and have data equally spread across the range of the distribution, then the distribution is called a uniform distribution.

Unusual Features
Common unusual features of data patterns are gaps and outliers.
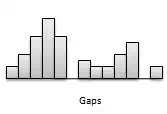
· Gaps – Gaps points to areas of a distribution having no observations. Following figure has a gap as there are no observations in the middle of the distribution.

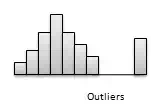
· Outliers – Distributions may be characterized by extreme values that differ greatly from the other set of observation data. These extreme values are refered as outliers. Following figure illustrates a distribution with an outlier.


