
A sales manager sees several large opportunities in the pipeline, yet only a few will close before the quarter ends. An operations team must decide how much inventory to order before demand becomes clear. Meanwhile, executives are preparing a budget while facing uncertain costs, staffing needs, and customer behavior.
These are not merely reporting problems. They are decisions about the future, made with incomplete information. Looking at last month’s dashboard helps explain what happened; it does not automatically reveal what is likely to happen next.
Predictive analytics helps organizations use historical data, current signals, and analytical models to estimate probable future outcomes. It does not remove uncertainty or replace judgment. It gives managers a more disciplined basis for deciding where to focus, what to prepare for, and when to intervene.
For students, it connects business data to real management choices. For working professionals, it offers a practical way to move from reactive reporting toward earlier, better-informed action.
🔎 What Predictive Analytics Actually Means
Predictive analytics is the use of data and statistical or machine-learning methods to estimate a future event, value, or category. A model may estimate the probability that a prospect will buy, forecast next month’s demand, or identify customers likely to cancel a subscription.
The output is usually a forecast, score, ranking, or probability—not a guaranteed answer. For example, “this deal has a high likelihood of closing” is more useful and more honest than claiming that the deal will definitely close.
Its business value comes from connecting a prediction to an action. A demand forecast matters when it influences purchasing, production, staffing, or delivery planning.
🧭 From Descriptive Reports to Forward-Looking Decisions
Business analytics is often described in stages. Descriptive analytics summarizes the past; diagnostic analytics investigates why something occurred; predictive analytics estimates what may occur; and prescriptive analytics recommends or helps choose an action.
| Analytical question | Example | Typical management use |
|---|---|---|
| What happened? | Revenue fell last month. | Performance reporting |
| Why did it happen? | One region lost several major accounts. | Root-cause investigation |
| What may happen next? | Which accounts are at risk of leaving? | Early intervention |
| What should we do? | Which accounts should receive retention support first? | Resource allocation |
These stages work together. A weak understanding of past data makes future predictions unreliable, while a prediction without an operating decision often becomes an interesting but unused dashboard.
🧩 The Basic Ingredients of a Useful Prediction
Most predictive applications need three things: a clearly defined outcome, relevant historical examples, and measurable signals that existed before the outcome was known. In technical language, those signals are often called features.
For sales conversion, features might include industry, company size, product interest, number of meetings, time since last contact, and source of the lead. For inventory demand, they may include prior sales, season, promotions, price changes, lead times, and stock availability.
The model learns patterns from past cases and applies them to new ones. The quality of that learning depends heavily on whether the past cases are accurate, comparable, and sufficiently representative of the decisions now being made.
🎯 Start With a Decision, Not a Model
A common mistake is beginning with, “What can our data predict?” A stronger starting question is, “Which recurring decision would improve if we had an earlier estimate of the outcome?”
Suppose a sales leader must assign limited solution-engineering support. Predicting deal-close probability may help, but only if the score is available before assignments are made and if the team can explain why support should be prioritized.
- Identify a repeated, consequential decision.
- Define the future outcome that affects it.
- Specify the action available after receiving a prediction.
- Estimate the cost of false alarms and missed opportunities.
This decision-first approach keeps analytics tied to business value rather than technical novelty.
🧹 Data Quality Sets the Ceiling
Predictive models cannot fully repair missing, inconsistent, or misleading business records. If sales representatives use different definitions of “qualified lead,” a conversion model may learn process inconsistency rather than customer intent.
Common problems include duplicate customer records, unrecorded lost deals, inaccurate close dates, stock-outs that disguise demand, and categories that change meaning over time. A model may appear precise while relying on flawed inputs.
Data preparation therefore includes agreeing on definitions, checking completeness, tracking changes in source systems, and documenting what each field means. This is often less glamorous than modeling, but it is core management work.
📏 Forecasts Are Ranges, Not Promises
All forecasts contain uncertainty. Demand can shift after a competitor’s move, a delayed shipment, a weather event, or a change in consumer confidence. A useful forecast communicates this uncertainty instead of hiding it behind a single number.
Managers can work with a central estimate plus a plausible range or several scenarios. For instance, a planning team may prepare a base case, a high-demand case, and a low-demand case, each with a different inventory or staffing response.
Good forecasting is not about being certain; it is about being better prepared for uncertainty.
💼 Sales Lead Scoring and Prioritization
Sales teams often have more leads than they can pursue deeply. A lead-scoring model ranks prospects according to their estimated likelihood of becoming qualified opportunities or customers.
Rather than treating every inquiry identically, the team can focus fast follow-up on leads whose characteristics and early engagement resemble prior successful cases. Lower-scoring leads may receive automated educational content or a lighter-touch review.
A score should support—not dictate—selling. A newly funded company may look unlike historical buyers yet be strategically valuable. Salespeople need a way to challenge scores and record information the model cannot see.
🤝 Improving Opportunity and Pipeline Forecasts
Once a lead becomes an active opportunity, the question changes from “Who should we contact?” to “Which deals are likely to close, when, and for how much?” Pipeline prediction may use stage history, deal size, contact activity, sales cycle length, product mix, and past outcomes from comparable deals.
This can reveal optimism hidden in manually assigned stages. If deals marked “late stage” have had no meaningful activity for weeks, a model may assign a lower probability than the stage label suggests.
Managers should use this insight in coaching conversations, not as a blunt performance weapon. A forecast becomes more trustworthy when it encourages accurate deal updates rather than pressuring people to report only favorable news.
🧑💼 Customer Retention and Churn Risk
Churn is the loss of customers, subscriptions, contracts, or active users over a defined period. Retention models look for patterns that appeared before previous customers reduced usage, failed to renew, or left.
Potential warning signals include falling product use, unresolved service issues, fewer stakeholder interactions, payment problems, or the end of a contract approaching. The exact signals vary widely by business model.
A churn score is most useful when paired with a retention playbook. High-risk customers might receive a success review, service recovery, executive outreach, or training—provided the intervention addresses a real need rather than becoming an intrusive sales call.
🛒 Anticipating Customer Demand
Demand forecasting estimates how much of a product or service customers are likely to want over a future period. Retailers may forecast units by store and product; a professional-services firm may forecast requested project capacity; a manufacturer may forecast demand by region and channel.
Historical sales provide a starting point, but sales are not always the same as demand. If an item was unavailable, low sales may reflect a stock-out rather than weak customer interest. Analysts should account for such constraints where possible.
Forecasting at the right level matters. A broad company-wide forecast may look accurate while being too vague to guide purchasing, warehouse allocation, or local staffing.
📦 Inventory Planning and Replenishment
Inventory decisions balance two costly errors. Ordering too much ties up cash, consumes storage space, and increases the risk of obsolescence. Ordering too little can cause lost sales, disappointed customers, and urgent shipping costs.
Predictive analytics supports replenishment by combining expected demand with supplier lead time, current stock, incoming orders, and desired service levels. Some items require frequent review because their demand is volatile or their replacement time is long.
The objective is not always the lowest possible inventory. For a critical spare part or a product with serious stock-out consequences, managers may deliberately hold more safety stock despite its carrying cost.
🏭 Production Scheduling and Capacity Choices
In operations, predicted demand helps determine what to make, when to make it, and which resources will be needed. A manufacturer may use forecasts to plan machine time, materials, shifts, and maintenance windows.
Capacity planning is especially valuable when resources cannot be adjusted quickly. Hiring skilled staff, adding production equipment, or booking specialized transport often requires lead time.
Predictions should be combined with operational constraints. A model may predict strong demand for a product, but production still depends on component availability, changeover time, quality requirements, and labor skills.
🚚 Supply Chain Risk and Supplier Reliability
Supply chains involve uncertainty beyond customer demand. Late deliveries, inconsistent quality, transport delays, and supplier financial stress can interrupt operations even when forecasts are accurate.
Businesses can monitor historical delivery performance, lead-time variation, defect records, order changes, and dependency on single sources. These signals can help identify purchase orders or supplier relationships needing earlier attention.
Risk prediction should not turn into automatic supplier exclusion. A supplier with a poor recent record may be facing a temporary disruption, while a model may miss contractual context or strategic capability. Human review remains necessary.
🛠️ Predictive Maintenance for Assets
Predictive maintenance estimates when equipment may require service before a failure occurs. It can draw on sensor readings, operating hours, repair histories, environmental conditions, and patterns associated with previous breakdowns.
For example, a facilities team may prioritize inspection of equipment that shows unusual vibration or temperature patterns. The goal is not to replace every component early; it is to time maintenance more intelligently.
This application works best where failures are recorded clearly and equipment conditions can be observed. For infrequently failing assets with little historical data, simple condition checks and preventive schedules may remain more practical.
👥 Workforce and Staffing Forecasts
Organizations can forecast workload to plan staffing levels and schedules. A contact center may estimate call volume by time of day, while a hospital administration team may forecast non-clinical support demand. The purpose is to reduce both understaffing and costly idle capacity.
Workforce analytics must be handled carefully. Forecasting workload is different from making high-stakes automated judgments about individual employees. Personal data, fairness, local laws, and employee trust require clear governance.
Managers should also avoid treating people as interchangeable capacity units. Skills, fatigue, training needs, and team coordination affect what staffing plans can realistically deliver.
💰 Cash Flow and Working Capital Planning
A profitable business can still experience cash pressure if customer payments arrive later than expected or inventory purchases occur before sales are collected. Predictive models can estimate payment timing, expected receipts, overdue-account risk, and near-term cash needs.
This supports decisions about collection activity, purchasing schedules, borrowing needs, and payment priorities. It is particularly useful when timing, not just total revenue, determines financial flexibility.
Cash predictions should include scenario planning. One delayed major payment can matter more than many small invoices, so managers need visibility into concentration risk as well as average behavior.
🧮 Budgeting With Drivers Instead of Guesswork
Traditional budgets may rely heavily on last year’s numbers plus a broad adjustment. Predictive planning can use operational drivers such as customer growth, sales pipeline, employee headcount, unit demand, utilization, and supplier costs.
Driver-based budgets make assumptions visible. If revenue expectations depend on hiring more salespeople or increasing conversion rates, leaders can test whether those conditions are realistic before committing resources.
A model should inform a budget conversation, not make it mechanical. Strategic investments, regulatory changes, product launches, and leadership decisions can create future conditions that historical data cannot fully represent.
🗺️ Scenario Planning for Strategic Choices
Prediction is often most valuable when it supports several plausible futures rather than one supposedly correct forecast. Scenario planning asks what the organization would do if demand is weaker, stronger, or shifted toward a different channel or customer segment.
A hypothetical retailer, for example, might model normal seasonal demand, a promotion-led surge, and a disruption in imported supply. Each scenario would have trigger points for ordering, staffing, and customer communication.
This approach gives leaders contingency options before pressure rises. It also exposes assumptions that may otherwise remain buried inside a single forecast number.
📣 Marketing and Sales Coordination
Marketing may optimize for inquiries or campaign response, while sales focuses on qualified opportunities and revenue. Predictive analytics can create a shared view by estimating which acquisition sources, messages, or customer profiles tend to produce valuable downstream outcomes.
That does not mean every campaign should target only people who resemble existing buyers. Over-optimization can narrow the market, reinforce past targeting habits, and overlook emerging segments.
Useful coordination includes agreed definitions, feedback on lead quality, and regular reviews of whether predicted high-value leads actually perform well after handoff.
⚖️ Measuring Model Performance in Business Terms
A technically accurate model is not automatically a valuable model. Managers must ask whether it improves decisions enough to justify its cost, complexity, and operational change.
For a churn model, it may matter more to identify a manageable group of genuinely at-risk, high-value customers than to produce an impressive-looking general score. For an inventory forecast, the relevant outcomes may include stock-outs, excess inventory, service level, and expedited shipping.
Performance measures should reflect the decision. False positives waste attention or resources; false negatives miss opportunities or risks. The two errors rarely have equal consequences.
🧪 Testing Before Full Deployment
Before relying on a predictive tool across the business, test it on historical data and, where feasible, in a limited live setting. Historical testing checks whether the model would have made useful predictions using only information available at the time.
A pilot can reveal practical obstacles: salespeople may not understand the scores, operations staff may receive forecasts too late, or required data may not refresh reliably. These are implementation issues, but they can determine whether the initiative succeeds.
Compare results with the current process. If a simpler rule or experienced planner performs just as well, a more complex model may not be justified.
🔄 Monitoring Drift and Changing Conditions
Models can degrade when the world changes. This is often called model drift: relationships learned from historical data no longer describe current conditions well.
A new pricing policy, changed sales process, product redesign, acquisition, supply disruption, or economic shift can alter customer and operational behavior. A formerly reliable model may then make systematically poor predictions.
Monitoring should track both prediction accuracy and changes in the input data. Refreshing or rebuilding a model is not an admission of failure; it is routine maintenance for a changing business.
⚠️ Bias, Fairness, and Responsible Use
Historical data can reflect unequal access, biased decisions, or incomplete measurement. If a past process favored certain customer groups, regions, or employee populations, a model trained on that history may reproduce those patterns.
Responsible practice includes checking whether outcomes differ unfairly across relevant groups, limiting sensitive data access, documenting intended use, and providing human review for consequential decisions. The appropriate safeguards depend on the context and jurisdiction.
Managers should be especially cautious when predictions affect employment, credit, pricing, eligibility, or access to essential services. Efficiency does not excuse unfair or unexplainable decisions.
🔐 Privacy, Security, and Data Governance
Predictive systems often combine data from customer relationship management tools, finance systems, websites, support platforms, and operational equipment. Combining useful data can also increase privacy and security risks.
Organizations need clear rules about who may access data, why it is collected, how long it is retained, and how it is protected. Data should be limited to what is necessary for the legitimate business purpose.
Good governance also records model ownership, data sources, assumptions, approval steps, and change history. When a prediction influences a significant decision, someone must be accountable for how the tool is used.
🧠 Explainability Builds Adoption
A black-box score can be difficult for managers to trust, especially when it conflicts with experience. Explainability means giving users understandable reasons behind a prediction, such as declining usage, a long period without customer contact, or unusually variable supplier lead times.
Explanations must be accurate and appropriately limited. They should show influential factors, not create the false impression that the model has discovered a simple cause-and-effect relationship.
When users understand both the logic and the limits of a tool, they are more likely to use it thoughtfully—and more likely to spot situations where human context should override it.
🧰 Choosing the Right Level of Complexity
Not every business problem needs advanced machine learning. A moving average, seasonal forecast, rule-based alert, or straightforward statistical model can be easier to maintain, explain, and improve.
Complexity is worthwhile when it produces a meaningful improvement for a decision and the organization has the data, skills, systems, and governance to sustain it. A sophisticated model that no one understands or maintains is not an operational asset.
Start with the simplest method that can address the decision well. Increase complexity only when evidence shows that the added capability changes outcomes.
🪜 A Practical Implementation Roadmap
Organizations usually gain more from a small, well-run use case than from a broad promise to “become predictive.” Choose a decision with accessible data, a clear owner, measurable outcomes, and a realistic opportunity to act on the result.
- Define the business decision and success measure.
- Map the data, process, users, and timing involved.
- Build a baseline using current rules or human forecasts.
- Develop and test a suitably simple predictive approach.
- Pilot the workflow with the people who will use it.
- Monitor results, update the model, and scale carefully.
This sequence makes adoption part of the project from the beginning rather than an afterthought after the technical work is complete.
🚫 Common Implementation Mistakes
Several errors repeatedly weaken predictive initiatives. The first is solving a vague problem, which makes it impossible to judge whether the model helped. The second is treating predictions as facts and ignoring uncertainty, exceptions, or new evidence.
- Using data that would not have been available at prediction time.
- Optimizing a technical metric that does not match business value.
- Launching scores without a clear action owner or workflow.
- Ignoring data quality because a model appears sophisticated.
- Failing to monitor results after deployment.
- Using sensitive predictions without adequate fairness and privacy controls.
These mistakes are organizational as much as analytical. A model can be mathematically sound and still fail because the surrounding process is poorly designed.
🏁 The Core Principle: Better Decisions Under Uncertainty
Applications in sales, operations, and business planning may look different, but they share the same logic. Use reliable information from the past and present to estimate future conditions, then connect those estimates to timely, accountable action.
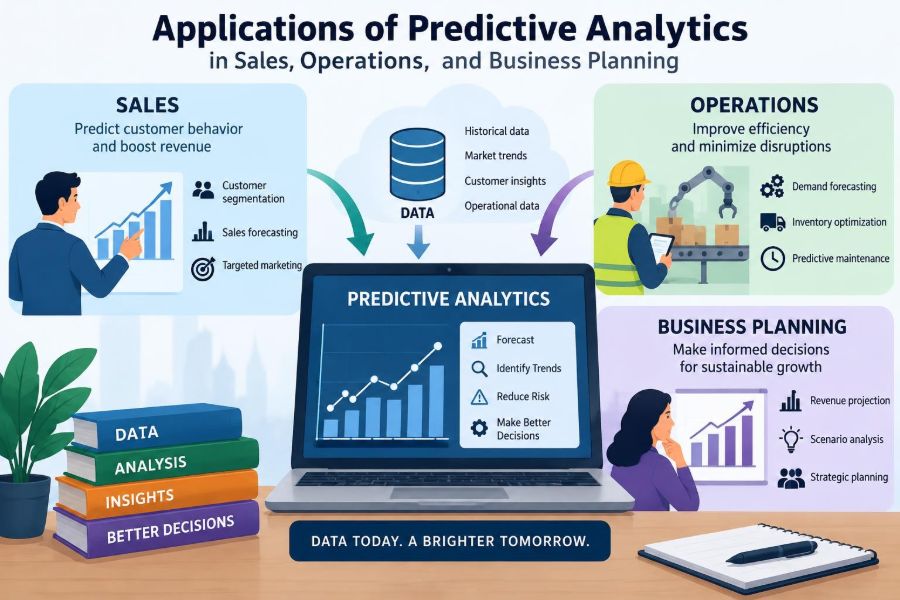
In sales, this may mean prioritizing leads, coaching pipeline decisions, or protecting at-risk accounts. In operations, it may mean preparing inventory, capacity, maintenance, and suppliers. In planning, it may mean building budgets and scenarios that reveal assumptions before resources are committed.
The strongest predictive practices combine analytical discipline with human judgment, transparent processes, and continual learning. They do not promise to eliminate uncertainty; they help managers see it earlier and respond more deliberately.
Predictive analytics creates value when it improves a real decision, at the right time, with appropriate human judgment and responsible use of data. Used this way, it becomes a practical management capability rather than a forecasting exercise. 📊🧭