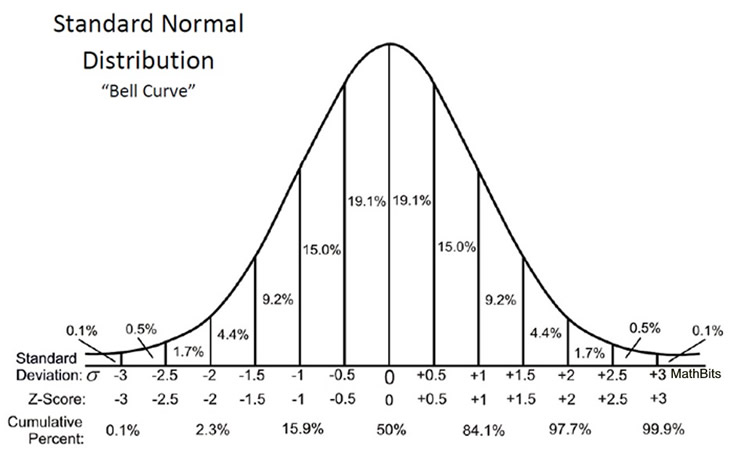
Posted inStatistics Statistics – Z table Posted by admin August 20, 2021 Standard Normal Probability Table The following table shows the area under the curve to the…
Posted inStatistics Statistics – Weak Law of Large Numbers Posted by admin August 20, 2021 The weak law of large numbers is a result in probability theory also known as…
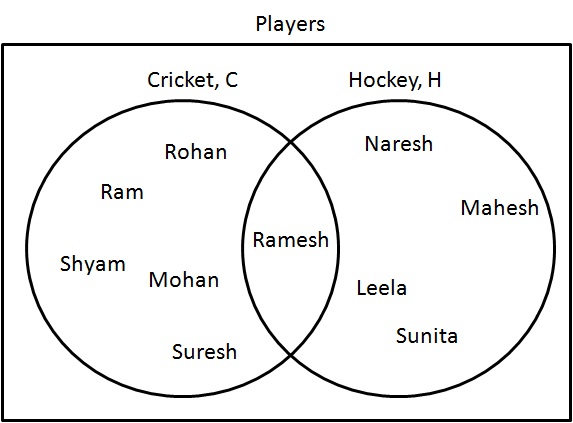
Posted inStatistics Statistics – Venn Diagram Posted by admin August 20, 2021 Venn diagram is a way to visually represents relationship between groups of entities or objects.…
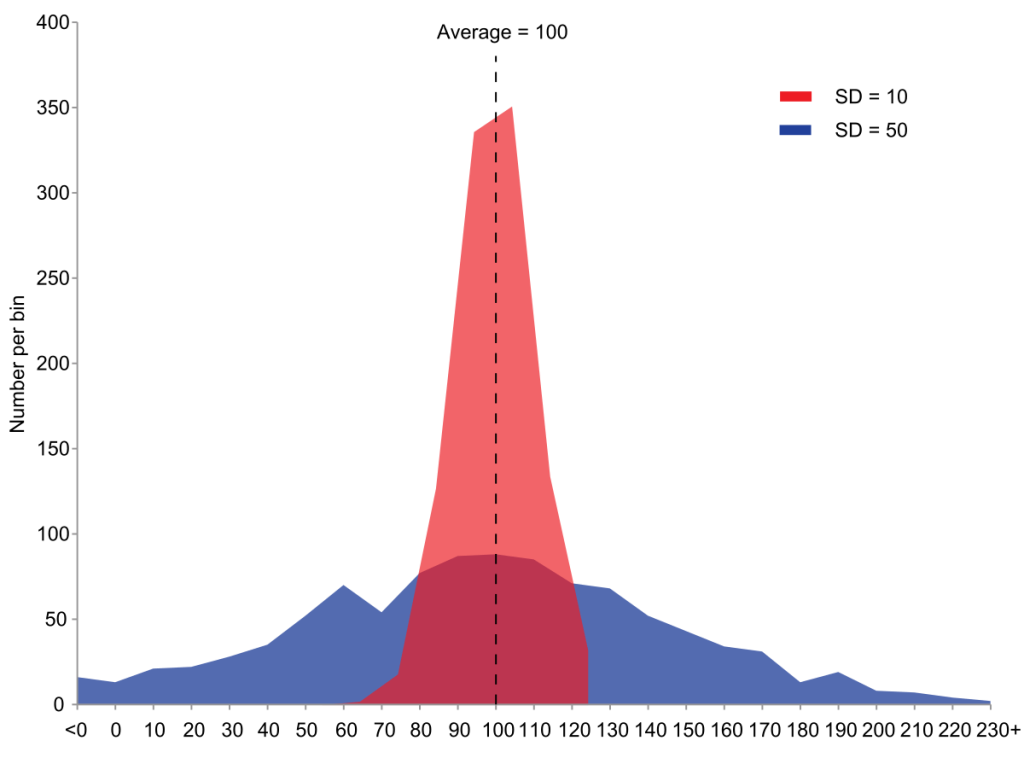
Posted inStatistics Statistics – Variance Posted by admin August 20, 2021 A variance is defined as the average of Squared differences from mean value. Combination is…
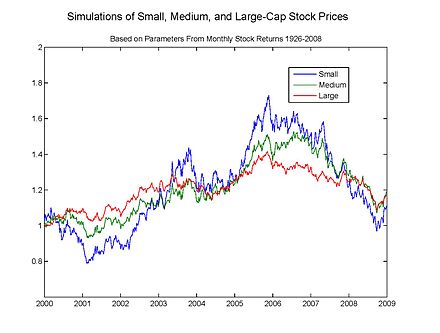
Posted inStatistics Statistics – Black-Scholes model Posted by admin August 20, 2021 The Black Scholes model is a mathematical model to check price variation over time of…
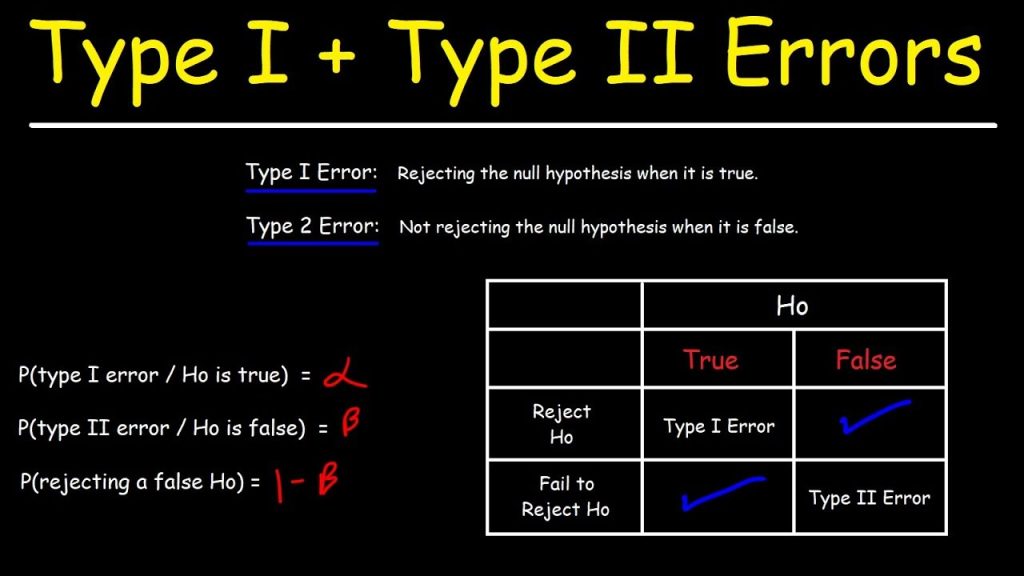
Posted inStatistics Statistics – Type I & II Errors Posted by admin August 20, 2021 Type I and Type II errors signifies the erroneous outcomes of statistical hypothesis tests. Type…
Posted inStatistics Statistics – Trimmed Mean Posted by admin August 20, 2021 Trimmed Mean a method of averaging that removes a small percentage of the largest and…
Posted inStatistics Statistics – Transformations Posted by admin August 20, 2021 Data transformation refers to application of a function to each item in a data set.…
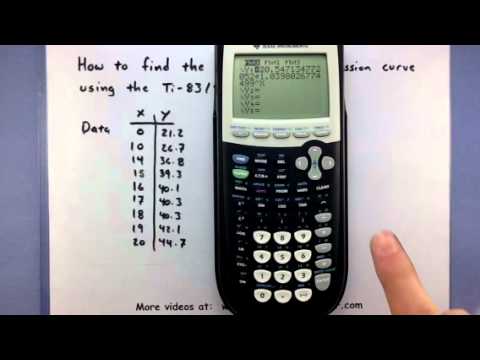
Posted inStatistics Statistics – Ti 83 Exponential Regression Posted by admin August 20, 2021 Ti 83 Exponential Regression is used to compute an equation which best fits the co-relation…
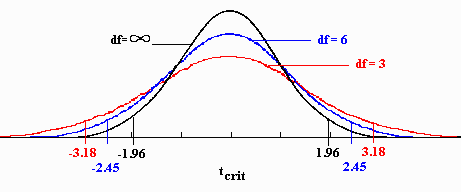
Posted inStatistics Statistics – T-Distribution Table Posted by admin August 20, 2021 The critical values of t distribution are calculated according to the probabilities of two alpha…