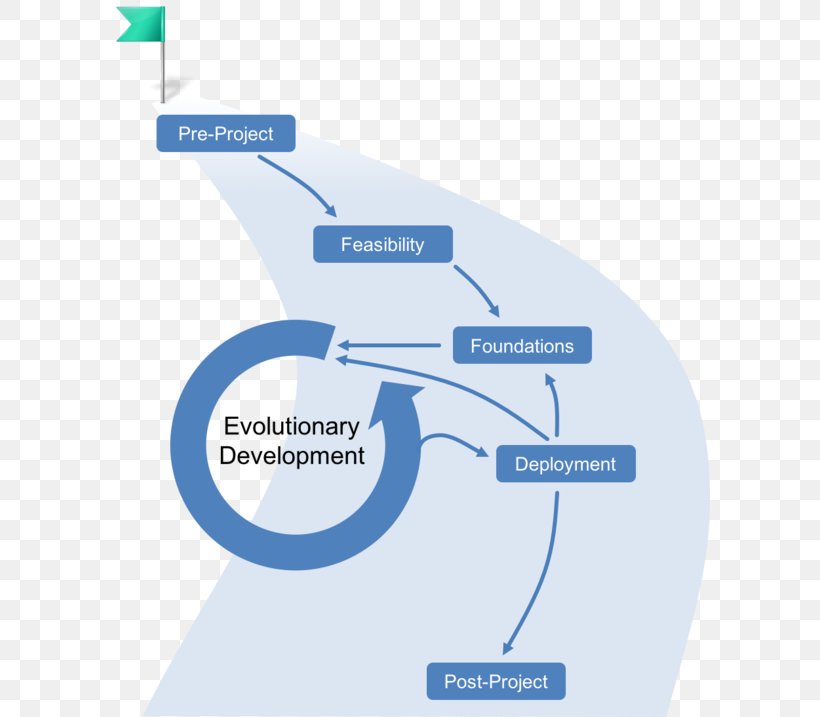
This chapter presents the Agile Project Dynamics (APD) model. Following the research into Agile methodologies and our formulation of the agile genome in the previous chapters, we now employ System Dynamics to build a model of the software project-system. Figure 37 is a notional illustration of the APD model as a “black box” system. As exogenous inputs to this model are project-specific parameters (system features, staff, number of releases, etc), project-team specific parameters (productivity, rework discovery rate, etc.) and “agile levers” (i.e. policies regarding which agile practices, or ‘genes’ to be used in the project). Based on these inputs, model simulations capture project performance as output in terms of cost, schedule, and quality.
APD Model High-Level Overview
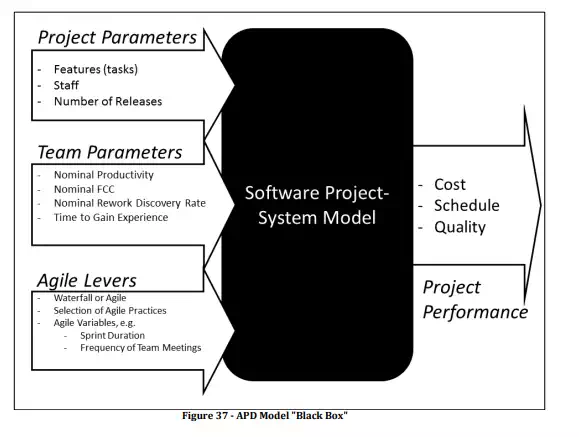
The APD model is a complex model developed using the Vensim PLE system dynamics modeling tool. It is built using several “views” which allow us to build different subcomponents of the model in isolation, and to link them via the use of “shadow variables”. At the core of the model is the “Agile Rework Cycle”. This consists of the rework cycle structure extended to support an iterative-incremental development style, or a single-pass waterfall approach – so that we can compare these differences. Figure 38 shows this cycle. Note that in this figure, many variables and causal links have been removed or renamed for clarity and display purposes. This full model structure, complete with all contributing variables and loops, is presented in Appendix 1 – The Full Agile Project Dynamics Model. Sections 5.2.1 and 5.2.2 will later explain how this structure supports the “Feature Driven” and “Iterative-Incremental” gene behaviours.
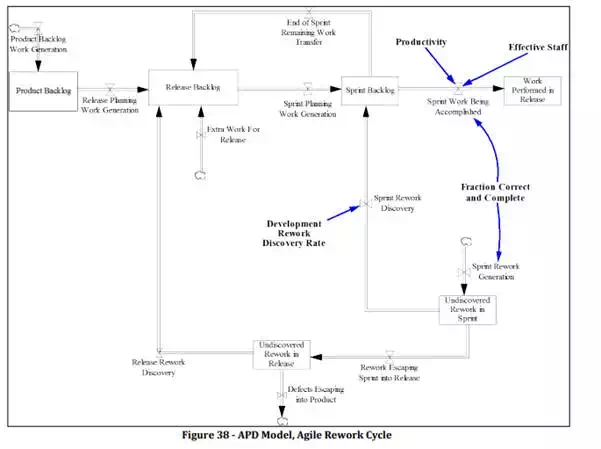
We characterize our complete model as “complex” because it includes 179 variables (parameters, lookup tables, equations) and a high number of feedback loops. The table below summarizes the number of loops that some of our key parameters are involved in:
Since there are so many loops driving the behavior of the system, we cannot hope to explain them all in this document, however what follows is a description of how all of the pieces ‘fit together’ in this model.
Each of the seven genes’ has its own set of dynamic effects on these controlling variables of the “Agile Rework Cycle” (Figure 38). In other words, each agile practice or characteristic has both positive and negative effects on:
· the rate at which work is accomplished,
· the rate at which defects are produced,
· the rate at which defects are discovered, and
· the rate at which working software is released.
Each gene, when possible, is modelled in its own view, and connected back to the agile rework cycle using shadow variables. Shadow variables are a mechanism in the Vensim modelling tool whereby a variable that appears in one model view can be referenced (or “imported”) into another model view. This allows linking model structure across views, and building ‘sub-systems’ of the model in multiple views.
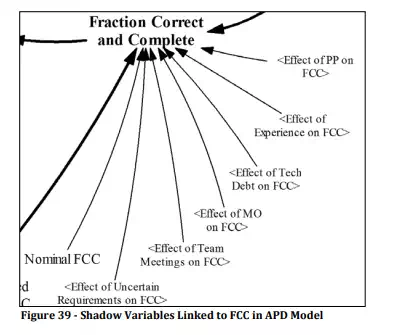
For example, Figure 39 shows how Fraction Correct and Complete (FCC) is influenced by a host of other variables. Each one of these shadow variables can be found in another view of the model – “Effect of Experience on FCC”, for example, can be found in the “Staffing and Experience” model view, as presented in section 5.2.8. In this case we are “linking” this view to other parts of the model using a formula for Fraction Correct and Complete that incorporates all these shadow variables to compute a (dynamically changing) FCC value.
It is important to note that there is a distinction to be made between the model itself, and a given simulation (or “run”) of the model with specific parameters. The model does not change, but it can be run with different parameters.