The portion of the model, shown in Figure 57, is a very simplistic approximation of the effects of the practices of Pair Programming (PP), and frequent (e.g. daily) meetings.
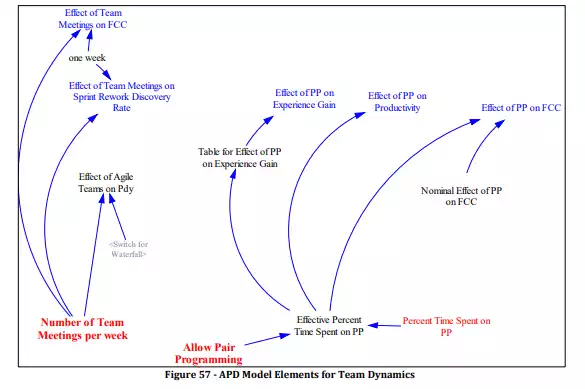
We know that in industry pair programming is not practiced 100% of the time. Typically developers spend 20% to 50% of their time doing PP. Thus Percent Time Spent on PP is set to 0.5 for our model, however it can be adjusted per project conditions.
We employ a switch (Allow Pair Programming) in the model to control whether Pair Programming is practiced – we can thus model the effects of PP on other parts of the system. These are:
· Effect of PP on Experience Gain: studies have shown greater experience gain through PP. We capture this effect in this variable.
· Effect of PP on Productivity; PP is reported to cause a reduction in productivity measures such as SLOC-per-month-per-person.
· Effect of PP on Defect Generation; PP results in better design and less defects, as it creates a form of real-time code review.
· We also employ a variable “Number of Team Meetings per week” to simulate Frequent team meetings (e.g. daily Scrum) and the two effects these have on the system:
· Effect of Team Meetings on FCC: The more frequent meetings, the more issues are raised, questions answered, leading to less defects in the software.
· Effect of Team Meetings on Sprint Rework Discovery Rate: Rework is discovered sooner through constant feedback, especially if a customer is involved in these meetings.
There is a third (and negative) effect that could be associated with the practice of regular meetings. Is it not true that the more meetings, the less time spent doing work? In most cases, the answer is yes. However in an Agile world, especially in the Scrum process, great attention is paid to making these team meetings extremely short and extremely productive. Daily Scrums are ideally ten to fifteen minutes stand-up meetings, often scheduled in the morning to start the day. The time this takes away from ‘doing the work’ is therefore negligible, which is we haven’t modelled this aspect.
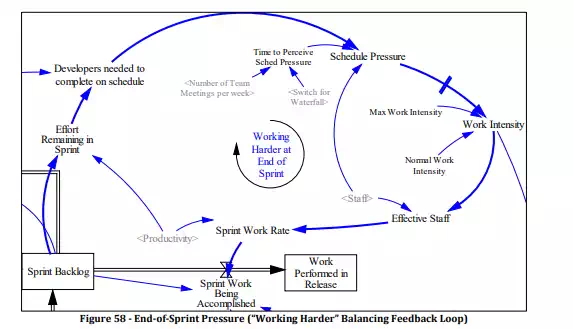
The other aspect of Team Dynamics that we presented in section 3.3.6 relates to the nature of schedule pressure in the Agile environment: frequent short bursts of schedule pressure are experienced at the end of each sprint.
This dynamic is captured in the feedback loop shown in Figure 58. A calculation of the number of extra Developers needed to complete on schedule (for the sprint) is calculated based on the Time Left in Sprint and the Effort Remaining in Sprint. If this number is greater than zero, then Schedule Pressure is perceived, after a short delay (controlled by Time to Perceive Sched Pressure). Schedule Pressure in turn drives work intensity (working harder, and using overtime), which then increases the Effective Staff, which is the product of actual Staff by Work Intensity. That will increase the Sprint Work Rate and tasks will be accomplished faster.
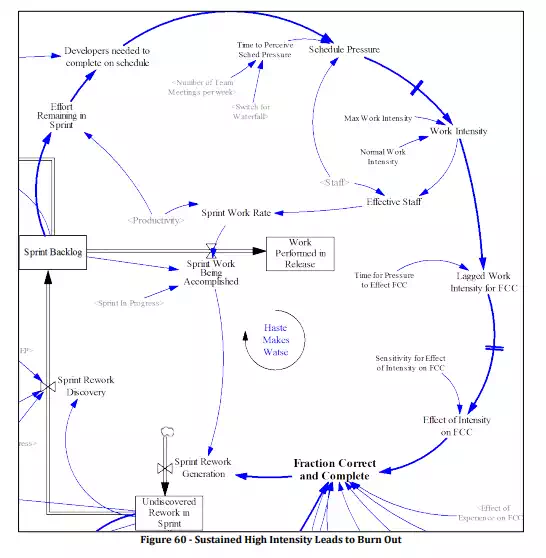
However, working at higher intensity also leads to more defect generation (“Haste Makes Waste”) as shown in Figure 59, since Work Intensity not only speeds up the completion of correct work, but also speeds up the generation of defects:
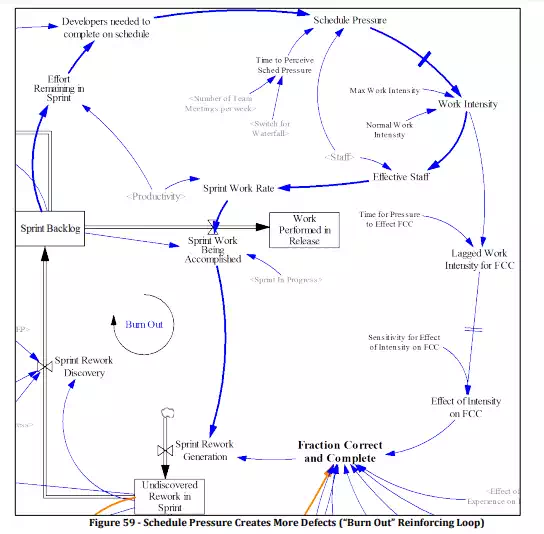
Moreover, working at high intensity is only sustainable for a short period of time before developers start to “Burn Out” and generate more defects than normal (i.e. becoming sloppy) –Figure 60 shows this loop in our APD model which captures the effect of increased Work Intensity leading to lower FCC.