Firstly, we can describe the opportunity cost to Mythica of producing a given output of computers or textbooks. For example, If Mythica produces 3m computers; the opportunity cost is 5m textbooks. This is the difference between the maximum output of textbooks that can be produced if no computers are produced (which is 70m) and the number of textbooks that can be produced if 3m computers are produced (which is 65m). Similarly, the opportunity cost of producing 7m computers is 31m textbooks – which is 70 – 39.
PPFs can also illustrate the opportunity cost of a change in the quantity produced of one good. For example, suppose Mythicacurrently produces 3 million computers and 65m textbooks. We can calculate the opportunity cost to Mythica if it decides to increase production from 3 million computers to 7 million, shown on the PPF as a movement from point A to point B. and textbooks is shown here.
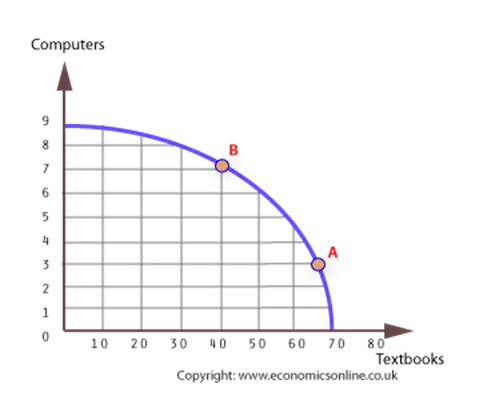
The result is a loss of output of 26 million textbooks (from 65 to 39m). Hence, the opportunity cost to Mythica of this decision can be expressed as 26m textbooks. In fact, this is the same as comparing the static opportunity cost of producing 3m computers (5m textbooks) and 7m computers (31m textbooks).
Comments are closed