
On Monday morning, a sales manager sees that revenue is up. By Wednesday, the operations manager is dealing with late deliveries, while the customer service team reports a growing queue of complaints. Each signal matters, but none tells the whole story alone.
Without a shared way to measure performance, managers can react to the loudest problem, reward the most visible activity, or rely on instinct. That can produce busy teams without producing better business results.
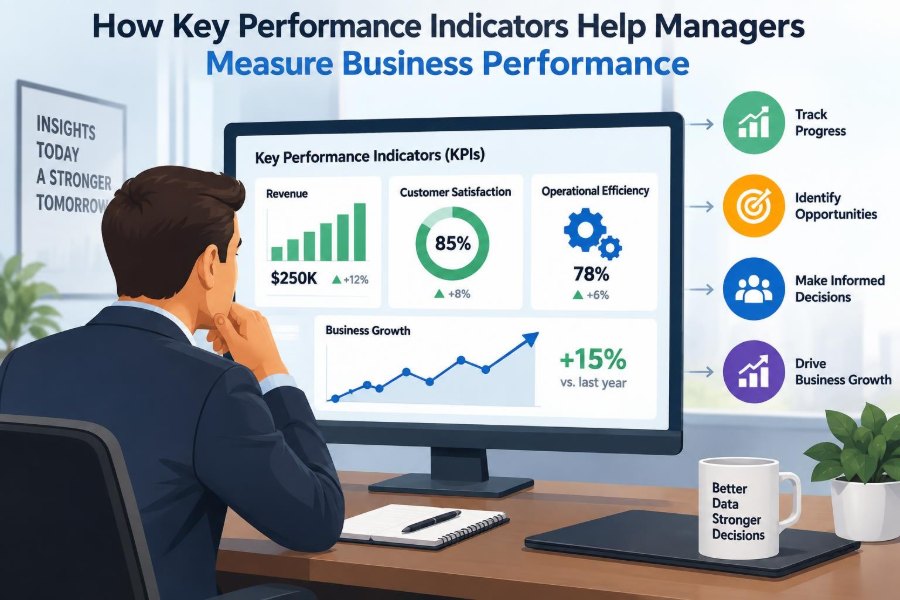
Key performance indicators, or KPIs, turn important business goals into observable measures. They help managers identify what is working, where performance is slipping, and which actions deserve attention.
The challenge is not simply collecting more data. It is choosing measures that connect daily work to meaningful outcomes, interpreting them in context, and using them to make better decisions. 📈
🎯 1. What a KPI Is
A key performance indicator is a measurable value used to assess progress toward an important objective. It is “key” because it focuses attention on a result that matters to the organisation, team, or process.
For example, a retailer may track sales revenue, but it might use customer return rate as a KPI if reducing product dissatisfaction is a strategic priority. A KPI is therefore more than a number on a report.
🧭 2. Why Managers Need KPIs
Managers make decisions about priorities, resources, staffing, budgets, and improvement work. KPIs provide evidence that supports these decisions rather than leaving them entirely to personal judgement.
They also create a common language. Finance, operations, marketing, and customer service can discuss performance against agreed measures instead of defending separate opinions.
🗺️ 3. Start With Business Objectives
A useful KPI begins with a clear objective, not with available data. Managers should first ask what the business is trying to achieve and why that outcome matters.
Objectives might include improving profitability, increasing customer retention, shortening delivery times, protecting cash flow, or developing employee capability. The measure should show whether progress toward that objective is occurring.
🔗 4. Connect Measures to Strategy
Strategy explains the choices an organisation makes to achieve its longer-term aims. KPIs translate those choices into measures that can be monitored regularly.
If a business strategy centres on reliable service, measures of order accuracy, response time, and customer satisfaction may be more informative than total sales alone. Alignment prevents teams from optimising activities that do not support the strategy.
⚖️ 5. Distinguish Metrics From KPIs
Many business measures are useful, but not every metric should be treated as a KPI. A metric may describe activity, while a KPI indicates progress on a priority outcome.
| Measure type | Typical purpose | Example |
|---|---|---|
| Operational metric | Monitors a task or process | Number of calls handled |
| KPI | Assesses progress toward a critical objective | Percentage of customer issues resolved within the agreed time |
| Diagnostic measure | Helps explain why a KPI changed | Calls waiting by time of day |
This distinction keeps performance reviews focused. Supporting metrics can explain a KPI, but they should not distract from the business outcome being managed.
⏳ 6. Understand Lagging Indicators
Lagging indicators measure results after they have happened. Profit, annual employee turnover, completed sales, and customer retention are common examples.
They are valuable because they reveal whether the business achieved an intended outcome. However, they may arrive too late for managers to prevent a problem.
🔮 7. Use Leading Indicators Carefully
Leading indicators track conditions or actions that may influence future results. Examples include the percentage of staff completing training, the number of qualified sales opportunities, or preventive maintenance completed on schedule.
A leading indicator is not automatically useful just because it occurs early. Managers need a reasonable, evidence-based connection between the activity measured and the result they want to improve.
🧩 8. Combine Leading and Lagging Measures
The strongest performance systems often use both kinds of indicators. Lagging indicators show whether the destination was reached, while leading indicators help teams steer before outcomes are fixed.
For instance, a service team may monitor customer retention as a lagging measure and first-response time as a possible leading measure. If retention falls, managers can investigate whether response delays, quality issues, or other factors are involved.
👥 9. Match KPIs to the Level of Management
Senior leaders need a broad view of organisational performance. Their KPIs commonly relate to financial health, market position, major risks, and strategic goals.
Middle managers usually need measures that connect departmental work to these outcomes. Frontline supervisors need timely, practical indicators that help them manage capacity, quality, safety, and service each day.
🏗️ 10. Build a KPI Hierarchy
A KPI hierarchy links measures across levels of the organisation. It shows how local actions contribute to departmental results and how those results support strategic performance.
For example, a company-wide goal to improve customer experience may connect to departmental measures for order accuracy, service response, product quality, and complaint resolution. The relationship should be understandable, not merely assumed.
📝 11. Define Every KPI Precisely
Ambiguous measures cause disagreement and unreliable reporting. A KPI definition should state exactly what is counted, who is included, what period is used, and how the calculation works.
Useful elements of a KPI definition
- Name: a clear description of the measure.
- Purpose: the objective it supports.
- Formula: how the value is calculated.
- Data source: where the information comes from.
- Owner: who reviews and acts on it.
- Frequency: how often it is updated and discussed.
Clear definitions allow people to compare results consistently over time. They also make handovers and audits easier.
🧮 12. Choose a Formula That Reflects Reality
A formula should be simple enough to explain but robust enough to represent the intended outcome. Ratios and percentages are often useful because they allow comparison across different periods, teams, or volumes.
For example, measuring complaints alone can be misleading if sales volume changes sharply. A complaint rate may offer a more meaningful picture, provided the denominator is appropriate.
🧼 13. Protect Data Quality
A KPI can only be as reliable as the data behind it. Missing records, inconsistent definitions, duplicate entries, delayed updates, and manual errors can produce false confidence.
Managers should ask basic questions: Is the data complete? Is it recorded consistently? Is the source trusted? Can unusual values be checked? Good governance matters as much as attractive dashboards.
📅 14. Set a Sensible Reporting Frequency
Different decisions require different reporting cycles. A warehouse supervisor may need daily information on picking accuracy, while a board may review long-term return measures monthly or quarterly.
Reporting too slowly can hide emerging problems. Reporting too often can encourage reactions to ordinary variation rather than meaningful change.
🚦 15. Set Targets and Thresholds
A target describes the desired level of performance. A threshold or tolerance range helps managers recognise when a result needs attention, investigation, or escalation.
Targets should be demanding enough to encourage progress but credible enough to support thoughtful planning. Arbitrary targets may encourage people to manipulate measures or sacrifice quality in pursuit of a number.
📊 16. Use Baselines Before Promising Improvement
A baseline is the starting level of performance before an intervention or new target is introduced. It helps managers understand what is normal, variable, improving, or deteriorating.
Without a baseline, a target can become a guess. Managers should also consider seasonal patterns, changes in demand, and differences between customer groups before interpreting a trend.
📉 17. Read Trends, Not Isolated Numbers
One poor week does not always signal a failing process, and one excellent month does not always prove an improvement. Managers should examine performance over time and look for sustained patterns.
Trend analysis encourages proportionate decisions. It reduces the risk of changing processes every time a number moves slightly.
🔍 18. Investigate the Story Behind a Result
A KPI identifies a question; it does not always provide the answer. If customer satisfaction falls, managers need to explore the causes through process data, staff insight, customer feedback, and operational evidence.
Possible explanations may include a product fault, staffing gap, confusing communication, delayed delivery, or a change in customer expectations. Diagnosis should come before a major intervention.
🛠️ 19. Turn Measurement Into Action
KPIs have limited value if no one uses them to decide, learn, or improve. A productive review asks what has changed, why it may have changed, what action is needed, and who owns the next step.
Actions should be specific and reviewable. Instead of saying “improve service,” a team might test a new triage process, assign an owner, set a review date, and watch the relevant measures.
🗣️ 20. Make KPI Reviews Constructive
Performance discussions should encourage openness, not fear. When people expect blame for every disappointing number, they may hide problems, delay reporting, or focus only on protecting themselves.
Managers can create better conversations by asking curious questions, recognising context, and separating accountability for action from automatic personal blame. Honest reporting is an organisational asset.
🎭 21. Avoid Measuring What Is Easy Instead of What Matters
Data that is readily available can be tempting, especially in digital systems. Yet a convenient count of emails sent or meetings held may say little about customer value, process quality, or business results.
Ask whether a measure would still be useful if it were difficult to collect. If the answer is no, it may be an activity measure rather than a meaningful performance indicator.
⚠️ 22. Watch for Unintended Consequences
People naturally respond to what is measured and rewarded. A narrow KPI can lead to behaviour that improves the reported number while harming the wider business.
For example, a call centre focused only on short call times may encourage rushed conversations and unresolved customer issues. Balanced measures and qualitative review can reduce this risk.
🧠 23. Keep the KPI Set Focused
A long dashboard can create the illusion of control while making priorities harder to see. Managers should select a manageable set of indicators that represent the most important dimensions of performance.
Supporting data can remain available for investigation, but the main scorecard should make it clear what leaders and teams need to notice first. Focus supports action. ✅
💼 24. Balance Financial and Non-Financial Performance
Financial measures are essential because they show whether the organisation can sustain its activities. However, they often reflect outcomes produced by earlier decisions and may not reveal future capability.
Non-financial KPIs can cover customers, quality, employees, innovation, safety, efficiency, and compliance. A balanced view helps managers avoid improving short-term financial results at the expense of longer-term value.
🤝 25. Give Each KPI Clear Ownership
Every KPI should have an accountable owner who understands the measure, checks data quality, leads review, and coordinates response. Ownership does not mean that one person controls every outcome.
Many KPIs depend on cross-functional work. Clear ownership simply ensures that no important result is left without attention when performance changes.
🔄 26. Review and Retire KPIs
KPIs should change when strategy, customer needs, technology, processes, or risks change. A measure that was useful during a growth phase may become less relevant once the business is focused on efficiency or retention.
Periodic review prevents dashboard clutter. Managers should retain measures that support decisions and retire those that no longer influence action.
🧑💻 27. Use Dashboards as a Starting Point
Dashboards can make trends, comparisons, and exceptions easier to see. Good visual design helps managers identify what requires attention without searching through large spreadsheets.
However, a dashboard is not a management system by itself. It must be supported by agreed definitions, reliable data, regular conversations, and disciplined follow-through.
🌱 28. Build a Culture of Learning From Performance
The most valuable KPI systems help teams learn. They encourage people to test improvements, assess evidence, share what worked, and adjust when assumptions prove wrong.
In this environment, a disappointing result is not ignored or celebrated; it is examined. Measurement becomes part of continuous improvement rather than a periodic compliance exercise.
🏁 29. The Core Principle: Measure What Helps the Business Improve
The purpose of KPIs is not to create more reports or to reduce management to a collection of numbers. Their purpose is to help people understand progress toward important goals and make informed choices.
Effective KPIs are strategically relevant, clearly defined, supported by reliable data, reviewed in context, and connected to action. They combine outcome measures with practical signals that help managers influence future performance.
When managers measure what matters, ask what the results mean, and act on what they learn, KPIs become a practical guide to stronger business performance. 📊 🚀 🌟