
A customer asks why their order has not arrived. A manager searches for a missing approval. An employee re-enters the same details into three systems because no one is sure which version is current.
These situations rarely come from one person making one obvious mistake. More often, they arise from a process that has grown through workarounds, handoffs, unclear decisions, and tools that do not connect cleanly.
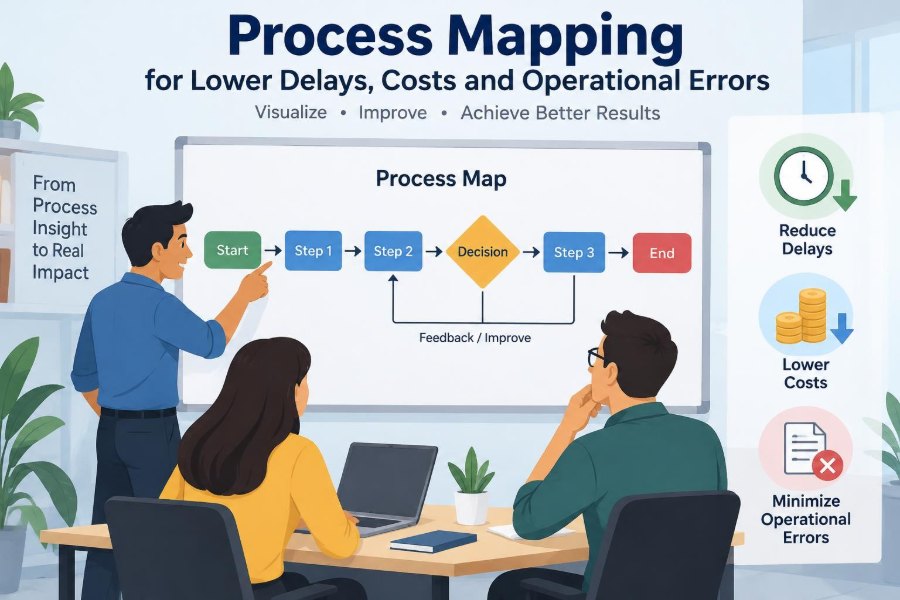
Process mapping makes that hidden work visible. It shows how work actually moves from a starting point to a finished outcome, including the waits, checks, loops, and points where information can be lost.
For students learning operations and professionals responsible for delivery, quality, or customer service, it is a practical way to turn a vague complaint—“this takes too long”—into a problem that can be examined and improved.
🗺️ What Process Mapping Really Means
A process map is a visual representation of the steps used to complete a piece of work. It may show a simple sequence, such as receiving an invoice and paying it, or a complex flow involving customers, departments, systems, and outside suppliers.
The map is not merely a flowchart drawn for presentation. Its purpose is to reveal how the process functions in practice: who does what, what information they need, where decisions occur, and what happens when something is incomplete or incorrect.
A useful map normally identifies the beginning and end of the process. Between those points, it records activities, handoffs, decisions, documents, systems, waiting periods, and feedback loops.
🔍 Why Everyday Work Becomes Hard to See
People usually understand their own tasks well but have a limited view of work before and after their part. A payroll clerk may know how to correct a timesheet without seeing that an unclear approval rule caused the correction request.
This local perspective can make a broken overall process appear normal. Employees adapt by chasing updates, keeping personal spreadsheets, or sending reminder emails. Those actions keep work moving, but they can conceal the underlying weakness.
Mapping creates a shared view. Instead of debating whose department is responsible, the group can examine the actual route that a request, product, or decision follows.
⏱️ Finding Delay Hidden Between Tasks
Many processes contain short tasks separated by long waits. Entering a customer request may take five minutes, yet the request may sit unassigned for two days. Measuring only active work time misses most of the customer’s experience.
A map distinguishes processing time—time spent doing work—from lead time, the total elapsed time from start to finish. The gap often consists of queues, approval delays, unavailable information, or work waiting for a scheduled batch.
Once waiting is visible, teams can ask better questions. Does every request need the same approval? Could complete cases move directly to the next step? Is work waiting because capacity is limited, or because the status is unclear?
🚦 Seeing Bottlenecks Instead of Guessing
A bottleneck is a point where work arrives faster than it can be handled, causing a queue to build. It may be a person with specialist knowledge, a shared machine, an overloaded manager, or a system that processes data only at certain times.
Process mapping helps distinguish a true bottleneck from a task that merely looks busy. For example, a quality reviewer may receive a large pile of cases because upstream staff send incomplete submissions. Adding reviewers alone may not solve the problem.
The practical response depends on the cause. Teams may simplify requirements, reduce errors before the bottleneck, cross-train staff, rebalance tasks, or change the order of work.
💸 Connecting Process Steps to Cost
Every unnecessary touch, correction, transfer, and follow-up consumes time. Over hundreds or thousands of transactions, even a small repeated activity can become a meaningful operating cost.
A map does not automatically calculate a financial value, but it identifies where cost analysis should focus. If staff repeatedly copy addresses between systems, managers can estimate the time involved and compare it with the cost of improving the system connection.
Cost reduction should not mean removing useful controls without thought. A short verification step may prevent expensive rework, customer refunds, or compliance failures later in the process.
⚠️ Locating Where Operational Errors Begin
An error often becomes visible far from where it began. A wrong delivery address may be noticed by the courier, but the original issue could have been a confusing online form, handwritten entry, or an outdated customer record.
Mapping helps trace the path backwards. Teams can identify where data is created, changed, checked, and passed on. This is more productive than treating every downstream error as an employee performance problem.
Common risk points include:
- manual re-entry of the same information;
- instructions that depend on individual memory;
- unclear ownership at handoffs;
- similar-looking choices in a software screen;
- exceptions handled outside the normal system.
🔄 The Difference Between the Official and Actual Process
Organizations often have a documented procedure, but the documented version may not match daily reality. Staff may use email instead of a workflow tool, skip a form that adds no value, or create an unofficial spreadsheet to track missing information.
The current-state map should show what people really do, including sensible workarounds. It is not an audit designed to embarrass employees. It is evidence about where the official process fails to support the work.
Only after understanding the current state can a team design a credible future-state map. A future map describes a better way of working, with clearer steps and fewer avoidable obstacles.
🏥 Example: Reducing Delays in a Clinic Appointment Process
Consider a hypothetical outpatient clinic where patients report long waits before appointments. A map may show that referrals arrive through several channels, are manually entered, checked for missing details, routed to a clinician for review, and then returned to administration for booking.
The map might reveal that incomplete referrals wait in an unmonitored inbox. It may also show that simple, routine referrals wait for the same clinical review as complex cases.
A safer improvement could be a standard referral form with required fields, a visible queue for missing information, and agreed criteria for routing routine cases. The goal is not to remove clinical judgment; it is to reserve that judgment for decisions that genuinely require it.
🛒 Example: Improving an E-Commerce Return
In a hypothetical online retailer, a returned item may move through customer contact, shipping label creation, warehouse receipt, product inspection, refund approval, and payment processing. Each stage can create uncertainty for the customer.
Mapping may reveal duplicate checks: customer service verifies eligibility, the warehouse repeats the same check, and finance requests a third confirmation before issuing a refund. Some checks may be necessary, but their timing and ownership may be poorly designed.
A revised process could collect evidence once, make the return status visible across teams, and define when a refund can be issued automatically. This reduces customer follow-up while preserving safeguards for unusual or high-value returns.
🏭 Example: Preventing Defects on a Production Line
In manufacturing, process maps can follow materials, information, and inspection results alongside physical products. A defect found at final inspection may reflect an earlier setup error, unclear work instructions, or delayed calibration information.
Mapping is especially valuable when different shifts perform the same work differently. The team can compare the actual sequence, inputs, and checks used by each shift rather than relying on assumptions about a standard method.
Not every variation is harmful. Some variation reflects skill and appropriate judgment. The question is whether it changes quality, safety, cost, or the ability to identify what happened when a defect occurs.
📑 Example: Streamlining Invoice Approval
Accounts payable processes are often slowed by invoices that lack purchase order details, arrive in multiple formats, or need approval from managers who are travelling or overloaded.
A map can separate invoices that match an approved purchase order from invoices requiring investigation. Treating both routes as identical forces low-risk, complete invoices through unnecessary waiting.
Clear spending limits, automated matching where appropriate, and a defined exception route can reduce delays. However, approval rules should reflect the organization’s financial controls and risk tolerance rather than pursuing speed alone.
👥 Making Handoffs Accountable
A handoff occurs when work passes from one person, team, system, or organization to another. Handoffs are common sources of delay because ownership becomes ambiguous: one team believes it has sent the work, while the next does not know it has arrived.
Maps should state what is handed over, in what format, and what condition it must meet. “Send request to operations” is vague; “submit a complete request through the service portal with the customer ID and delivery date” is testable.
Strong handoffs also include a response expectation. This does not have to be a rigid promise for every case, but staff need to know how the receiving team acknowledges, prioritizes, or returns incomplete work.
🧩 Using Swimlane Maps for Cross-Functional Work
A swimlane map arranges steps into lanes for different roles, departments, or systems. It is particularly useful when a process crosses functions, such as sales, legal, finance, and delivery.
The lanes make unnecessary back-and-forth visible. If an application repeatedly moves between customer service and compliance because neither has complete information, the map exposes a design problem rather than blaming either group.
Swimlanes can become crowded, so they work best when the scope is controlled. Map one meaningful journey—such as “approve a new supplier”—rather than attempting to depict the entire organization.
🌊 Value Stream Thinking and Customer Value
Value stream mapping is a broader approach that examines the end-to-end flow of materials and information. It asks which activities create value from the customer’s perspective and which activities consume resources without improving the outcome.
Some non-value-adding activities are still necessary. Regulatory records, security checks, and quality controls may not feel valuable to a customer, but they can be essential to operating responsibly.
The useful distinction is between necessary work and avoidable waste. Re-entering a known customer number because systems do not share data is usually different from confirming a customer’s identity before a sensitive account change.
📊 Choosing the Right Level of Detail
A map that is too broad may say little more than “receive, process, complete.” A map that is too detailed can become unreadable and discourage discussion. The right level depends on the improvement question.
If the question is why new hires take weeks to become productive, a detailed task map may help. If the question is why a customer waits ten days for a decision, an end-to-end view with timing and handoffs may be more useful.
Start with enough detail to identify meaningful delays, decisions, and error risks. Add detail only where evidence suggests a problem needs closer examination.
🧰 Common Process Mapping Formats
Different formats serve different purposes. Choosing one should depend on the audience and the decision to be made, not on which diagram looks most sophisticated.
| Format | Best use | What it highlights |
|---|---|---|
| Simple flowchart | Explaining a clear sequence | Steps and decisions |
| Swimlane map | Cross-team processes | Roles and handoffs |
| Value stream map | End-to-end operations | Flow, waiting, and waste |
| SIPOC view | Defining a process boundary | Suppliers, inputs, process, outputs, customers |
A SIPOC view is often useful before a detailed map. It helps a team agree on where the process begins and ends, preventing discussions from expanding into unrelated issues.
📝 Gathering Evidence Before Drawing
Good maps are built from observation and conversation, not from a manager’s memory alone. Ask the people who perform the work to describe their actual steps, the information they receive, and the situations that cause exceptions.
Useful evidence can include system timestamps, sample cases, forms, queue reports, and customer contacts. Data adds discipline, but it should be interpreted with staff who understand why unusual cases occur.
When observing work, avoid treating one unusual day as the entire process. Look for recurring patterns and distinguish normal variation from an occasional disruption.
🗣️ Involving the People Who Do the Work
Employees may be wary of mapping exercises if they believe the result will be used to eliminate roles or judge individual performance. Leaders should explain the scope and focus on improving the system, not assigning blame.
Frontline staff often know where effort is wasted because they experience the friction directly. They can explain why a workaround exists and identify risks that a high-level diagram would miss.
Involvement also improves adoption. A redesigned process is more likely to work when the people using it have helped test whether the proposed steps are realistic.
❓ Mapping Decisions and Exceptions
Many maps fail because they describe only the ideal path. Real operations include incomplete applications, unavailable stock, disputed charges, urgent requests, and technology failures.
Decision points should state the question clearly, such as “Is the request complete?” or “Does the invoice match the approved order?” Each possible route needs an owner and a next action.
Exception paths deserve special attention because they often create the longest delays and greatest error risk. A process can look efficient for routine cases while frustrating customers whenever anything falls outside the norm.
🤖 Identifying Smart Automation Opportunities
Process maps help teams decide where automation is appropriate. Good candidates are repetitive, rule-based activities with reliable inputs, such as routing complete requests, checking a standard field, or notifying a customer of a status change.
Automation is less suitable when the task requires contextual judgment, empathy, negotiation, or interpretation of unusual evidence. Automating a poorly designed process can simply make the same confusion happen faster.
Before automating, simplify the steps and define ownership for failures. Someone must monitor exceptions, correct bad data, and review whether automated rules still reflect current policy.
🔒 Building Controls Without Creating Gridlock
Controls protect quality, security, finances, and compliance. Examples include approvals, reconciliations, segregation of duties, and documented evidence. They are not automatically bureaucracy.
Problems arise when controls are duplicated, applied to low-risk work without reason, or inserted after a failure without examining the root cause. A process may accumulate checks until no one can explain which risks each check addresses.
A map allows teams to ask whether a control is preventive, detective, or corrective. Preventive controls stop an error before it happens; detective controls identify it afterward; corrective actions restore the process once an issue is found.
📈 Measuring Whether an Improvement Worked
A redesigned map is a hypothesis, not proof of improvement. Teams need measures that reflect the original problem, such as elapsed time, backlog age, rework volume, first-time-right completion, or number of customer follow-ups.
Use a baseline where possible, then track results after the change. Numbers should be read alongside quality and staff experience. A faster process that creates more corrections or transfers burden to customers has not necessarily improved.
Measures should not encourage harmful shortcuts. For instance, rewarding staff only for closing cases quickly may lead them to close incomplete cases that later return.
🧪 Testing Changes on a Manageable Scale
Large process changes carry risk because they affect multiple people and systems. A limited pilot can test a new form, routing rule, or approval threshold before it is used widely.
Define what the pilot includes, what it excludes, and what signals would show a problem. Gather feedback from users and customers where appropriate, then revise the design before broader implementation.
Testing does not eliminate uncertainty, especially in seasonal or highly variable operations. It does create a safer learning cycle than imposing an untested solution across the organization.
🚫 Common Mistakes That Make Maps Less Useful
One mistake is mapping in isolation. A diagram created by one person can reflect assumptions rather than the lived process. Another is confusing a map with an improvement plan; visibility matters only if it leads to decisions and action.
- Using vague labels such as “process request” instead of observable actions.
- Ignoring waiting time, queues, and rework loops.
- Drawing only the happy path and omitting exceptions.
- Redesigning before confirming the real cause of delay.
- Creating a complex map that no team member can explain or maintain.
A clear, imperfect map that supports a useful conversation is usually more valuable than a polished diagram that no one uses.
🧠 Avoiding the “Blame the Person” Trap
When errors repeat, organizations may assume employees need to be more careful. Individual capability matters, but recurring errors often point to process conditions: confusing forms, unrealistic workload, poor system design, missing information, or conflicting rules.
Process mapping does not excuse careless or unethical conduct. Instead, it separates personal accountability from system design. This distinction supports fairer investigation and more durable solutions.
If many capable people make the same mistake at the same point, the process deserves scrutiny. A well-designed system makes the correct action easier and the wrong action easier to detect.
🌱 Standardizing What Should Be Standardized
Standard work means agreeing on the best known method for routine tasks, including the expected sequence, information, and checks. It reduces unnecessary variation and makes training easier.
However, standardization should not erase professional judgment. Customer complaints, complex projects, and clinical or technical assessments may require adaptable responses within clear boundaries.
A process map can show where consistency matters most and where flexibility is appropriate. This prevents the false choice between rigid scripts and entirely informal work.
🔁 Treating Process Mapping as Ongoing Management
Processes change when systems are updated, teams reorganize, policies evolve, or customer needs shift. A map created once and stored away will gradually become less reliable.
Teams should review maps after material changes and when performance signals deteriorate. Ownership matters: someone needs responsibility for keeping the process description current and coordinating improvements.
This does not require constant redrawing. It means treating the map as a working operational tool, especially for processes with recurring delays, high volumes, customer impact, or meaningful risk.
🎓 Building Process Literacy Across a Team
Process literacy is the ability to see work as a connected system rather than as isolated tasks. It helps staff ask practical questions: What triggers this work? What input is missing? Who receives the output? Where does it wait?
For students, mapping a familiar activity—registering for a course, submitting an expense claim, or ordering food delivery—can make the idea concrete. For professionals, short mapping sessions can strengthen collaboration across departments.
The objective is not to make everyone a diagram specialist. It is to develop a shared habit of examining flow, ownership, information, and outcomes before jumping to solutions.
🧭 A Practical Starting Sequence
Choose one process with a clear problem and a manageable boundary. “Improve customer service” is too broad; “reduce the time to resolve address-change requests” gives the team something observable to investigate.
- Define the trigger, outcome, customer, and scope.
- Gather the people, evidence, and sample cases needed to understand current work.
- Map the current state, including waits, decisions, rework, and exceptions.
- Identify the most consequential cause or constraint rather than changing everything.
- Design, test, measure, and refine a practical improvement.
Small, well-scoped wins build confidence and reveal lessons that can be applied to more complex processes later.
🏁 The Core Principle: Make Work Visible Before Changing It
Process mapping is valuable because it converts invisible friction into a shared, testable picture. It reveals that a delay may be caused by a queue rather than a slow worker, and that an error may start with poor information rather than a final check.
The strongest maps combine operational detail with balanced judgment. They protect necessary controls, respect frontline knowledge, and recognize that different cases may need different paths.
When teams can see the flow of work, they can make more deliberate choices about what to simplify, standardize, automate, monitor, or leave flexible. That is how mapping supports lower cost and fewer mistakes without losing sight of quality and customer needs.
The central lesson is simple: improve the process people work in, not just the effort people put into working around it. 🗺️📊✅