
A café can be packed from morning to closing time and still struggle to make money. A clothing retailer can report rising sales while quietly losing room to pay rent, salaries, and interest. Revenue alone does not tell us whether a business is becoming healthier.
Margins help answer the question behind the headline: after the business earns a dollar of sales, how much of that dollar remains after different layers of cost? They turn a long income statement into a clearer view of pricing, production, overhead, and financial discipline.
For students, margins make accounting statements more meaningful. For managers and working professionals, they provide a practical language for diagnosing performance and making trade-offs.
Two of the most useful measures are gross margin and operating margin. They are related, but they reveal different parts of the business story.
🧭 Start With the Income Statement
An income statement summarizes a company’s revenue, expenses, and profit over a period. It is usually arranged in layers: revenue at the top, direct costs next, operating expenses below that, and then items such as interest and taxes.
Margins express one of those profit layers as a percentage of revenue. This makes companies of different sizes easier to compare. A small firm earning $200,000 in sales can be assessed on the same basis as a large firm earning millions.
💵 Revenue Is the Starting Point, Not the Finish Line
Revenue, also called sales or turnover, is the money earned from providing goods or services before expenses are deducted. It is a measure of commercial activity, not automatically of success.
A business may increase revenue by cutting prices, entering a new market, or selling more low-margin products. Each move can grow sales while weakening profitability. Margins show whether growth leaves enough economic value behind.
🧾 What Cost of Goods Sold Means
Cost of goods sold (COGS) is the direct cost of producing or acquiring what a business sells. For a bakery, it may include flour, ingredients, packaging, and production labor. For a retailer, it is primarily the cost paid to buy inventory for resale.
COGS should not be confused with every cost of running the company. Office rent, marketing, executive salaries, and accounting software are commonly operating expenses rather than direct product costs.
📐 The Gross Profit Formula
Gross profit is revenue minus COGS. It represents the money left after covering the direct cost of the products or services sold.
Gross profit = Revenue − Cost of goods sold
If a retailer generates $100,000 in sales and the inventory it sold cost $60,000, gross profit is $40,000. That $40,000 must still fund the wider business before any final profit exists.
📈 Calculating Gross Margin
Gross margin converts gross profit into a percentage of revenue:
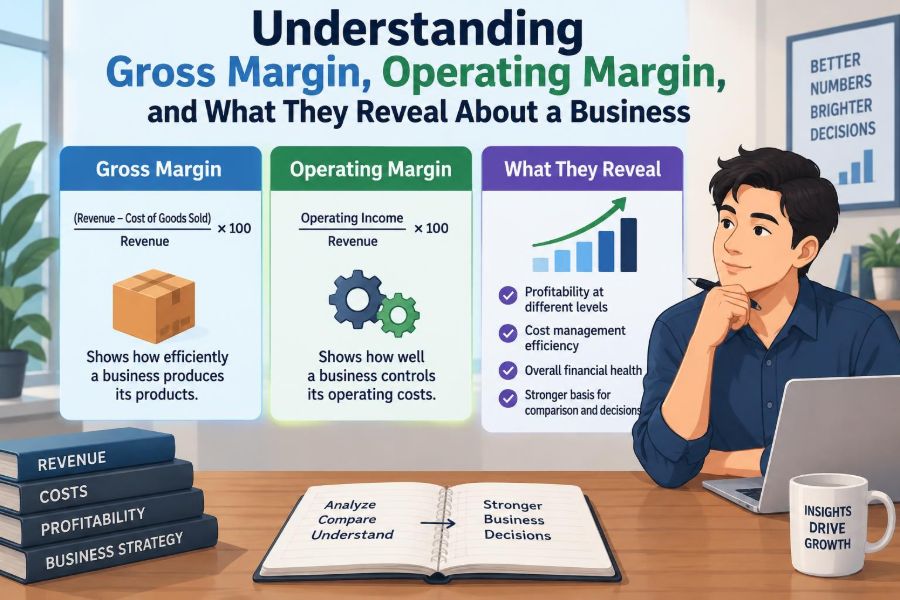
Gross margin = Gross profit ÷ Revenue × 100
In the retailer example, $40,000 divided by $100,000 produces a gross margin of 40%. In simple terms, the company retains 40 cents from each sales dollar after paying for the goods it sold.
Margins are usually more informative than gross profit in dollars when comparing periods or companies, because they adjust for the scale of sales.
🏷️ What a Gross Margin Reveals
Gross margin is often a window into a company’s basic economic model. It reflects the relationship between selling price and direct cost: what customers pay compared with what it costs to deliver the product or service.
A stable or improving gross margin can suggest pricing power, effective purchasing, efficient production, or a favorable product mix. A falling margin can signal discounting, input-cost inflation, waste, competitive pressure, or a shift toward lower-margin offerings.
🛒 A Simple Retail Example
Imagine a hypothetical home-goods store. It sells a lamp for $80 and paid a supplier $44 for it. Ignoring other costs, the gross profit is $36 and the gross margin on that sale is 45%.
If the supplier raises the price to $50 but the store keeps the selling price at $80, gross margin falls to 37.5%. The lamp still produces a positive gross profit, but it contributes less toward payroll, rent, advertising, and other operating costs.
🍽️ Gross Margin Varies Widely by Industry
There is no universally “good” gross margin. A software business may have relatively low direct delivery costs after building its product, while a grocery retailer typically sells high volumes with much narrower margins. Manufacturers, restaurants, distributors, and service firms each have different cost structures.
| Business type | Typical gross-margin driver | Common pressure point |
|---|---|---|
| Retailer | Buying terms and product mix | Supplier prices and markdowns |
| Manufacturer | Production efficiency and pricing | Materials, labor, and scrap |
| Restaurant | Menu pricing and food cost | Waste, portion control, and ingredient inflation |
| Software provider | Subscription pricing and scalable delivery | Hosting, support, and customer acquisition |
The useful benchmark is generally a company’s own history and comparable businesses with similar models, not an unrelated industry average.
🔄 Product Mix Can Change the Picture
A company does not need to alter the price or cost of every item for its total gross margin to move. Selling more of a lower-margin item can reduce the company-wide result, even if individual product margins are unchanged.
For example, a technology retailer may sell more accessories with strong margins one quarter and more discounted computers the next. Total revenue can rise in both periods, yet the overall gross margin can decline because the sales mix changed.
⚙️ From Gross Profit to Operating Profit
After direct costs are deducted, a business must pay the expenses required to run the organization. These are commonly called operating expenses, or OPEX.
They often include sales and marketing, administrative staff, office or store rent, research and development, technology, insurance, and depreciation linked to operations. When these expenses are subtracted from gross profit, the result is operating profit.
🧮 Calculating Operating Margin
Operating margin measures operating profit as a percentage of revenue:
Operating margin = Operating profit ÷ Revenue × 100
Suppose the retailer with $100,000 of revenue has $40,000 of gross profit and $28,000 of operating expenses. Operating profit is $12,000, so its operating margin is 12%.
That 12% shows what remains from each sales dollar after both direct product costs and ordinary running costs have been covered.
🏢 What Operating Margin Reveals
Operating margin captures a broader test of business performance than gross margin. It asks not only whether a product is sold profitably, but also whether the organization supporting those sales is appropriately sized and managed.
A firm can have an attractive gross margin yet a weak operating margin if it spends heavily on advertising, maintains expensive premises, or carries more administration than its revenue can support. Conversely, disciplined overhead can help turn a modest gross margin into a solid operating result.
🔍 Gross Margin Versus Operating Margin
The gap between gross margin and operating margin deserves attention. It represents the share of revenue consumed by operating expenses, though accounting classifications can affect the exact interpretation.
- Gross margin focuses on direct economics: pricing, sourcing, and delivery costs.
- Operating margin adds the cost of running and growing the business.
- The difference helps managers examine whether overhead is justified by the value it creates.
Neither measure replaces the other. Together, they identify where profit is being retained and where it is being absorbed.
🧱 Why Expense Classification Matters
Margin analysis depends on consistent accounting treatment. One company may classify warehouse labor as COGS, while another may place similar costs in operating expenses. Their gross margins may then look different even if their underlying economics are similar.
This is especially relevant in service, technology, and platform businesses, where the boundary between direct delivery costs and overhead can be less obvious. Read the company’s accounting notes and use caution when comparing reported margins across firms.
📉 When Gross Margin Falls but Operating Margin Holds
This pattern can occur when a business faces higher direct costs but offsets them through lower overhead or greater operating efficiency. It might renegotiate leases, automate routine work, reduce waste, or scale administrative costs more slowly than sales.
The result may be acceptable for a period, but it raises a strategic question: are cost savings sustainable, or is the business merely delaying a response to weakening product economics?
📊 When Gross Margin Holds but Operating Margin Falls
A stable gross margin with a falling operating margin often points below the gross-profit line. The company may be spending more to acquire customers, opening new locations, investing in product development, or coping with rising salaries and rent.
Those costs are not automatically bad. Expansion and research may support future growth. The key is whether management can explain the spending, show what it is intended to achieve, and eventually convert that investment into durable returns.
🚨 When Both Margins Decline
Declining gross and operating margins together can indicate pressure on both the product-level model and the organization. The company may be discounting while direct costs rise, and its fixed expenses may not be shrinking quickly enough.
This is a signal to investigate rather than a verdict. A temporary disruption, deliberate market entry, or accounting change may be involved. Still, a persistent double decline usually requires a clear operational response.
📈 When Both Margins Improve
Improvement in both measures may indicate a stronger pricing position, better procurement, more efficient production, favorable mix, or operating leverage. Operating leverage occurs when revenue grows faster than certain fixed operating costs, allowing more gross profit to reach operating profit.
For example, a subscription business may add customers without needing to double its head-office staff. The benefit is real, but it should be tested over time; one unusually low-cost period does not establish a lasting trend.
🕰️ Trend Analysis Beats a Single Snapshot
A one-period margin can be distorted by seasonality, promotions, launch costs, inventory adjustments, or timing of expenses. Examining several quarters or years provides a more reliable view of direction and volatility.
Ask practical questions: Did margins change gradually or suddenly? Did revenue grow at the same time? Was the change driven by a known event, such as a product launch or a supply disruption? Context turns a ratio into an explanation.
🧩 Fixed Costs and Variable Costs
Variable costs tend to rise as more units are sold or produced, such as materials, shipping, sales commissions, or payment-processing fees. Fixed costs are less directly tied to immediate sales volume, such as a lease or certain salaried roles.
High fixed costs can make operating margins improve rapidly when sales grow, but they can also create risk when revenue declines. Managers need to understand which costs can adjust quickly and which are committed for longer periods.
🎯 Pricing Decisions Show Up in Margins
A price increase can improve gross margin if customer demand remains sufficiently strong and costs do not rise by the same amount. But price is not a lever to pull without consequence. Customers may buy less, switch brands, or choose a cheaper product.
Effective pricing decisions consider customer value, competitors, price sensitivity, product differentiation, and capacity. The objective is not always the highest price; it is often the best combination of volume, margin, and long-term customer relationships.
📦 Purchasing, Waste, and Process Control
Many gross-margin improvements come from operational details rather than headline decisions. Better supplier terms, reduced defects, accurate forecasting, lower spoilage, improved inventory control, and efficient packaging can lower direct costs without weakening customer value.
These improvements require care. Cheaper materials or aggressive supplier pressure can harm quality, delivery reliability, or relationships. A lower cost is useful only if it does not create larger costs elsewhere.
📣 Growth Spending Can Temporarily Reduce Operating Margin
Operating margin may decline when a company deliberately hires a sales team, launches in a new region, builds a support function, or develops a new offering. That is not necessarily poor management.
Managers and readers should separate productive investment from recurring inefficiency. Useful evidence includes whether revenue, customer retention, capacity, or future cost savings are plausibly connected to the spending. Vague promises of future scale deserve more scrutiny.
🧑💼 How Managers Use Margin Analysis
Margin analysis works best when it guides specific decisions. A manager can compare product lines, customer groups, locations, channels, or suppliers to find where economics differ.
- Review product-level gross margins before expanding a promotion.
- Track labor and occupancy costs against sales for each location.
- Compare planned operating spending with the revenue or capability it should produce.
- Investigate large changes rather than waiting for year-end results.
The purpose is not to maximize every ratio in isolation. It is to allocate resources where the business can create sustainable value.
🧑🎓 How Students Can Read a Case Study
When analyzing a company case, begin by rebuilding the logic from the income statement. Calculate gross profit, gross margin, operating profit, and operating margin for each period using the same definitions.
Then explain movements in plain language. Do not merely state that a margin “went down.” Identify the likely driver: price, unit cost, sales mix, marketing spend, labor, rent, or a strategic investment. The explanation is usually more valuable than the calculation.
🧠 Common Mistake: Treating High Margin as Automatic Quality
A high gross margin can be attractive, but it does not prove a business is healthy. It may have tiny sales volume, heavy marketing costs, large research expenses, weak cash collection, or debt obligations that emerge below operating profit.
Likewise, a low-margin business can be viable if it has rapid inventory turnover, reliable demand, careful cost control, and enough operating profit after scale. Margin needs to be interpreted alongside the entire business model.
💳 Common Mistake: Confusing Margin With Cash
Profit margins are based on accounting revenue and expenses, while cash flow tracks money actually received and paid. A business can report a profit yet face cash strain if customers pay slowly, inventory builds up, or it must pay suppliers before collecting from buyers.
For a fuller assessment, compare margins with operating cash flow, working capital needs, debt payments, and capital expenditure. Profitability and liquidity are connected, but they are not the same thing.
🧷 Common Mistake: Ignoring One-Off Items
Restructuring charges, unusual legal costs, asset sales, or other non-recurring events can affect reported operating results. Companies may also present adjusted measures that exclude selected items.
Adjusted figures can help isolate ongoing performance, but they should not be accepted uncritically. Check what has been excluded, whether similar exclusions recur, and whether the adjustments make economic sense. Reported and adjusted results can both offer useful, different perspectives.
⚖️ Comparing Companies Fairly
Compare companies that have similar products, customers, and accounting approaches. A direct-to-consumer brand and a wholesale distributor may sell related products but have very different marketing, logistics, and channel economics.
Also compare similar periods. Seasonal businesses can produce misleading conclusions if a busy quarter is placed beside a quiet one. The cleanest comparisons use consistent definitions, comparable time frames, and relevant peer groups.
🗺️ A Practical Margin Review Checklist
A regular review can turn margin data into action. The process does not need to be complicated, but it should be consistent.
- Calculate gross and operating margins for the current and prior periods.
- Identify the largest movements in revenue, COGS, and operating expenses.
- Break the change down by product, customer, location, or channel where possible.
- Separate temporary effects from structural changes.
- Choose a specific response, owner, deadline, and measure of success.
Without the final steps, a margin report can become an interesting document rather than a management tool.
🔮 Limits of Margin Forecasting
Forecast margins require assumptions about price, volume, wages, materials, exchange rates, competition, and customer behavior. Small changes in these assumptions can materially change the outcome, particularly for firms with thin margins.
Use scenarios rather than one confident forecast: a base case, an upside case, and a downside case. This encourages managers to identify which assumptions matter most and what actions are available if conditions change.
🌱 Sustainable Margin Improvement
The strongest margin gains usually come from improving the value delivered to customers while making the business more efficient. Better product design, clearer positioning, reliable quality, smarter purchasing, useful automation, and a disciplined cost base can reinforce one another.
Short-term cuts can lift a ratio but damage service, innovation, employee capability, or customer trust. Sustainable improvement asks a harder question: can the business earn more from each sales dollar without undermining the reason customers buy?
✅ The Core Principle to Remember
Gross margin explains the economics of what a company sells. Operating margin explains how effectively the company converts those product economics into profit after running the business.
Read them together, over time, and in context. Look beyond the percentage to the drivers underneath it: price, cost, mix, scale, investment, and accounting classification. That is where the useful business insight lies.
Margins are not just accounting ratios; they are a structured way to understand where a business creates value, where it loses it, and what decisions may improve its future. 📊💼🔍