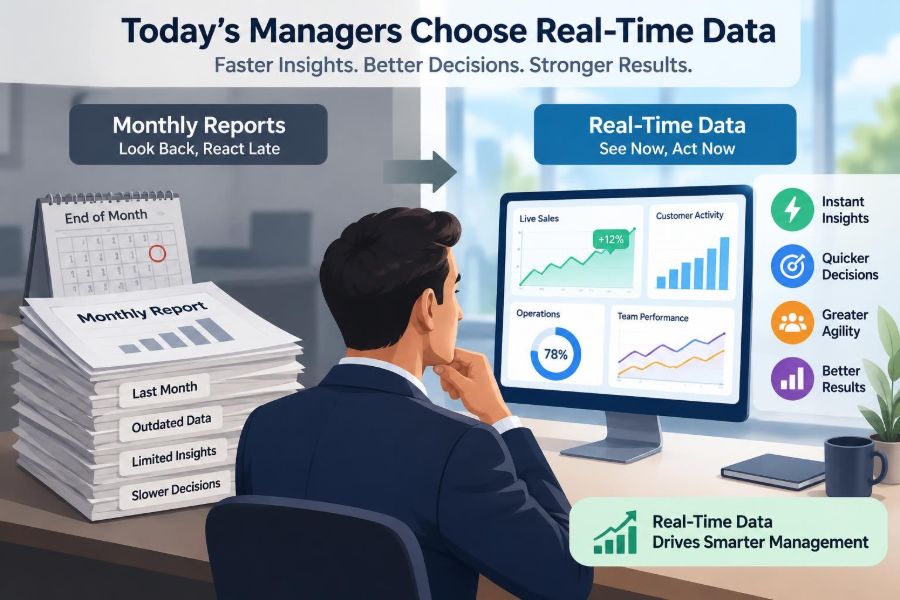

It is Monday morning, and a regional manager opens the monthly performance report. The numbers show that sales fell, customer complaints rose, and delivery costs climbed. The problem is that the report describes a period that ended weeks ago.
By the time the manager sees the pattern, a stock shortage may already have lost sales, a service queue may have frustrated hundreds of customers, or a campaign may have spent most of its budget on the wrong audience. The report is accurate, but it is no longer early enough to guide the best response.
This is why many managers now use real-time data: information that is updated continuously or at short, useful intervals. Rather than waiting for a retrospective summary, they can see what is happening while there is still time to influence the outcome.
That does not make monthly reports obsolete. They remain valuable for reflection, governance, and long-term planning. But for operational decisions, modern management increasingly depends on a clearer and more current view of the business.
🕒 The Limits of the Traditional Monthly Report
A monthly report usually consolidates information after a reporting period closes. It may include revenue, expenses, staffing, production, customer service, and project progress. Its main strength is consistency: everyone reviews a shared, validated record.
Its weakness is delay. Managers often receive it after data has been collected, checked, adjusted, and circulated. When conditions change quickly, that delay turns management into an exercise in explaining the past rather than shaping the present.
⚡ What Real-Time Data Actually Means
Real-time data is information made available soon enough to affect a decision. It does not always mean updates every second. For a warehouse supervisor, an hourly inventory update may be real-time enough; for a cybersecurity team, seconds may matter.
The useful question is not “Is this instantaneous?” but “Is this current enough for the decision we need to make?” This prevents organisations from investing in speed that offers no practical value.
🎯 Decisions Have Different Time Windows
Every decision has a window during which action can still change the result. A restaurant manager can move staff between stations during a busy lunch period, but not after unhappy customers have left. A procurement manager can reorder a fast-moving item before stock runs out, but not after production stops.
Real-time dashboards shorten the gap between event, insight, and action. Monthly reporting is better suited to decisions whose consequences unfold over longer cycles, such as annual budgets or strategic portfolio reviews.
🔄 From Rear-View Mirror to Windshield
Monthly reports are often compared to a rear-view mirror: they show where the organisation has been. Real-time data acts more like a windshield, helping managers see conditions ahead and adjust course.
The analogy has limits. A dashboard does not predict the future by itself. It simply reveals recent movement quickly enough that managers can ask better questions, investigate causes, and intervene before a small issue becomes expensive.
📈 Faster Feedback Changes Management
Management improves when people can connect an action with its result. If a call-centre leader changes a scheduling rule and sees queue times fall during the same day, the team can learn quickly. If feedback arrives only next month, many other changes may have occurred in the meantime.
Short feedback loops support experimentation, provided managers set sensible controls. Teams can test a revised process, monitor quality and customer impact, and keep, adapt, or reverse the change based on evidence.
🛒 A Simple Retail Example
Consider a hypothetical clothing retailer with several stores. A monthly report might reveal that one location missed its sales target. A real-time view can show something more actionable: a popular size is unavailable, fitting rooms are backed up, or a promotion is creating demand without enough staff on the floor.
Those are different problems requiring different responses. Replenishing stock, reallocating staff, and changing a promotion are operational choices that lose value if they wait until the month is over.
🚚 Operational Bottlenecks Become Visible Earlier
Many business problems begin as small constraints: an approval queue grows, a machine runs slowly, a supplier shipment is late, or a team lacks a required skill. These signals are easy to miss in aggregated monthly totals.
Live operational measures reveal where work is accumulating. Managers can then ask whether the bottleneck is temporary demand, a process design flaw, inadequate capacity, poor data, or an exception that needs escalation.
👥 Customer Experience Cannot Wait for Month-End
Customers experience a business in the moment. They do not care that a service failure will appear in a well-formatted report later. Long wait times, failed payments, unavailable products, and unanswered messages can all damage trust immediately.
Useful current indicators include open support cases, response-time trends, order failures, cancellation patterns, and recurring complaint themes. These measures help managers protect the experience while recovery is still possible.
📦 Inventory Decisions Depend on Timely Signals
Inventory is a balance between availability and cost. Too little stock can mean lost sales or interrupted operations; too much can tie up cash and create storage, spoilage, or obsolescence risks.
Current sales, returns, supplier status, and stock movement allow managers to respond to changes in demand. Yet the data should be interpreted with care: a one-day spike may reflect an event, a data error, or a promotion rather than a lasting shift.
💰 Cash Visibility Supports Daily Choices
Profit and cash are related but different. A business can record sales while waiting to be paid, and it can face immediate obligations despite appearing profitable in a period-end statement.
Current views of receivables, payments due, payment failures, and expected cash movements help finance and operating managers coordinate. This is especially relevant where margins are tight or payment timing is unpredictable.
📣 Marketing Becomes More Adaptive
Marketing teams once had to wait for campaign summaries before adjusting spend or creative material. Digital channels can now provide near-current signals such as traffic quality, conversion activity, cost patterns, and customer responses.
These signals do not automatically identify cause. A conversion change may result from seasonality, a website problem, pricing, or an audience shift. Still, timely visibility lets teams pause wasteful activity, investigate anomalies, and protect budgets sooner.
🏭 Quality Problems Spread When Detection Is Slow
In production and service delivery, defects often create more defects. A faulty input, unclear instruction, or software issue can affect every item processed after the error begins.
Real-time quality checks can flag rising rework, error codes, failed inspections, or unusual return rates. Early containment reduces the amount of work that must be corrected and makes root-cause investigation more manageable.
🧭 Dashboards Turn Data Into a Shared View
A dashboard brings selected measures into one visible place. Done well, it gives people across functions a common operating picture rather than separate spreadsheets with conflicting versions of events.
Shared visibility matters because many issues cross departmental boundaries. A late delivery may involve sales promises, inventory accuracy, supplier reliability, warehouse capacity, and customer communication. A shared view encourages coordinated action instead of blame.
🧩 Metrics Need Context, Not Just Colourful Charts
A red indicator may signal a problem, but it does not explain it. Managers need context: a target, a recent trend, a relevant comparison, and knowledge of what changed in the operation.
For example, higher support volume may be concerning, or it may reflect a successful product launch. A dashboard should make investigation easier, not encourage quick conclusions from isolated numbers.
🧮 Leading Indicators Offer Earlier Warnings
Lagging indicators describe outcomes that have already occurred, such as monthly revenue or completed turnover figures. Leading indicators are earlier signals associated with future outcomes, such as a growing sales pipeline, missed maintenance checks, or increased delivery delays.
Real-time management is most useful when it combines both. The outcome tells managers what happened; the earlier signal gives them a chance to influence what happens next.
| Measure type | Example | Typical management use |
|---|---|---|
| Leading indicator | Orders waiting to be processed | Prevent delivery delays |
| In-process indicator | Current queue time | Reallocate staff or capacity |
| Lagging indicator | Monthly customer retention | Review results and strategy |
🧠 Real-Time Data Does Not Replace Managerial Judgment
Data can show a change, but managers must interpret its meaning. A sudden fall in transactions may be a serious demand problem, a planned maintenance window, or a fault in the reporting system.
Good judgment adds operational knowledge, customer understanding, and awareness of trade-offs. The goal is not to obey a dashboard; it is to make more informed decisions with the people closest to the work.
🚨 Alerts Should Signal Exceptions, Not Create Noise
Alerts are valuable when they direct attention to conditions that genuinely need action. If managers receive too many notifications, they begin to ignore them, including the important ones.
Effective alert design defines a meaningful threshold, identifies an owner, and states an expected response. A message that says “queue time is high” is less useful than one that identifies the affected queue, its duration, and the team responsible for review.
🧹 Poor Data Quality Creates Fast Confusion
Speed does not compensate for inaccurate, incomplete, duplicated, or poorly defined data. A real-time dashboard fed by unreliable systems can spread false confidence faster than a delayed report.
Common causes include inconsistent definitions, late system updates, manual entry errors, and records that do not match across departments. Managers should know where the data comes from, how often it refreshes, and what its known limitations are.
📏 Define Each Metric Before Managing It
Terms that sound obvious often are not. “Sales,” “active customer,” “on-time delivery,” and “available inventory” can be calculated in several legitimate ways. Different definitions can produce different conclusions.
A basic metric definition should state what is included, excluded, measured, and updated. This small discipline prevents meetings from becoming arguments over numbers rather than discussions about decisions.
🔐 Access and Privacy Still Matter
More available data can create risks when it includes employee, customer, financial, or commercially sensitive information. Managers should have access to what they need, not unrestricted access to everything.
Role-based permissions, sensible retention practices, and clear handling rules help protect information. Privacy, contractual obligations, and applicable regulations vary by location and sector, so organisations should seek appropriate specialist guidance where needed.
⚖️ Watching Performance Is Not the Same as Micromanaging
Real-time data can support frontline teams, but it can also be misused to monitor every movement or judge people from a single metric. That approach can increase stress and encourage workers to optimise the measure rather than serve the customer or improve the process.
Use data to remove obstacles, improve staffing, and start constructive conversations. When individual performance is relevant, assess it fairly with context, qualitative evidence, and clear expectations.
🪞 The Risk of Managing Only What Is Measured
Not everything that matters appears neatly on a dashboard. Trust, creativity, collaboration, safety culture, and employee confidence may require conversations, observation, and qualitative feedback.
A manager who focuses only on visible metrics can overlook hidden costs. For instance, a team may reduce average handling time by rushing customers, which can later create repeat contacts and dissatisfaction.
🧪 Correlation Is Not a Cause
Two changes occurring together do not prove that one caused the other. Sales may rise after a campaign launches, but a seasonal event, competitor disruption, or pricing change may also be involved.
Managers should treat dashboard patterns as prompts for investigation. Compare relevant periods, check operational records, ask people close to the work, and avoid announcing a cause before the evidence supports it.
🧱 Start With Decisions, Not With Software
A common mistake is buying a dashboard platform before identifying the decisions it should improve. This often produces impressive screens filled with measures that nobody owns or uses.
Begin with a practical question: “What recurring decision is currently too slow, uncertain, or reactive?” Then identify the signals, data sources, update frequency, and actions that would make that decision better.
🗺️ Choose a Small Set of Operational Questions
Early real-time reporting should focus on a manageable number of high-value questions. A team might ask whether demand is exceeding capacity, whether orders are at risk, whether key stock is running low, or whether service levels are deteriorating.
- What condition are we trying to detect early?
- Who needs to act when it changes?
- What action is realistically available?
- How quickly must the information update?
- What would confirm that the action worked?
These questions connect reporting to management rather than treating data as a display project.
🔗 Connect Data Across the Workflow
A useful decision often requires more than one system. A delivery issue may need order information, warehouse status, carrier updates, and customer contact records. Separate views can hide the chain of events.
Integration is valuable when it follows a real workflow. It is not necessary to connect every data source immediately; prioritise the handoffs where delays, mistakes, or customer problems are most costly.
👷 Give Every Key Measure an Owner
A metric without ownership can generate concern but no response. Ownership does not mean one person is blamed for every result; it means someone is responsible for understanding the measure, maintaining its definition, and coordinating action when it changes.
Clear ownership also makes dashboards more trustworthy. Users know who can explain an anomaly, correct a data issue, or decide whether an alert threshold should change.
🧑🤝🧑 Build Data Literacy Across the Team
Managers do not need to become data scientists to use current information well. They do need basic confidence with trends, averages, variation, definitions, and the difference between a signal and a one-off fluctuation.
Teams benefit from regular conversations about what their measures mean and what they do not mean. This makes data use less dependent on a small analytics group and improves the quality of questions at every level.
🗓️ Monthly Reports Still Have an Essential Role
Monthly reporting offers a stable period for reviewing financial performance, comparing plans with actual results, examining trends, and meeting internal or external reporting requirements. It can include reconciliations and commentary that real-time operational screens do not provide.
The strongest approach is not a choice between old and new. It is a layered reporting rhythm: current data for immediate control, weekly views for near-term coordination, and monthly reports for disciplined review and strategic learning.
🔍 Review the System, Not Just the Number
When a measure misses its target, the instinct may be to pressure the person closest to it. Often the better question is what in the system produced the result: demand variability, unclear rules, inadequate tools, conflicting priorities, or a weak handoff.
Real-time visibility is especially powerful when it supports problem solving. Managers can see the condition, involve the relevant people, test an improvement, and monitor whether the workflow actually becomes more reliable.
🌱 Build Capability in Stages
Organisations do not need a perfect enterprise-wide data platform before gaining value. A focused pilot around one recurring operational problem can reveal data gaps, training needs, and governance requirements.
A sensible progression is to prove usefulness, improve data reliability, expand to adjacent decisions, and review whether the reporting changes behaviour. Scaling too quickly can reproduce confusion across more teams.
🏁 The Core Principle: Timely Information Enables Timely Action
Modern managers rely on real-time data because many business outcomes are shaped before the month ends. Current information reveals exceptions, bottlenecks, customer friction, and emerging opportunities while managers can still allocate people, adjust processes, or communicate clearly.
But speed alone is not management. The most effective systems combine timely data with reliable definitions, appropriate access, human judgment, and clear action. Monthly reports then become a valuable complement: a chance to verify, reflect, and learn from the fuller picture.
The purpose of real-time data is not to watch everything faster; it is to help people make the right decision while that decision can still make a difference. 📊🧭