
A customer asks for a simple update on an order. What should take two minutes turns into a trail of emails, a spreadsheet search, a call to another department, and a request for manager approval. Nobody involved is careless; the work has simply accumulated steps over time.
Situations like this appear in every kind of organization. A clinic struggles to schedule appointments, a retailer keeps correcting invoices, a university takes weeks to approve a purchase, or a small business owner becomes the bottleneck for every decision.
These problems are often described as “people issues” or “communication issues.” Sometimes they are. But the more useful question is usually: what does the work actually travel through from beginning to end?
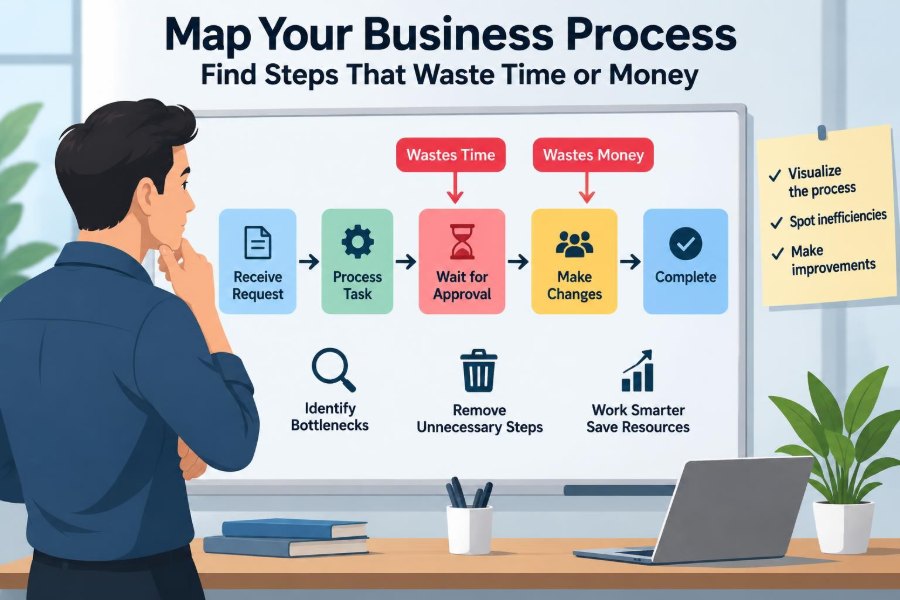
A business process map makes that path visible. Once a team can see the real process—not the ideal version in a procedure manual—it can identify delays, duplication, rework, unnecessary cost, and risks that are otherwise easy to normalize.
🧭 What a business process map is
A business process map is a visual or structured description of how work gets done. It shows the sequence of activities, decisions, people, systems, inputs, and outputs involved in delivering a result.
For example, an order-to-cash map may begin when a customer places an order and end when payment is received. Between those points, it may show credit checks, stock confirmation, picking, packing, invoicing, delivery, and follow-up.
The map does not need to be an elaborate technical diagram. Its first purpose is practical: give everyone a shared, testable view of the work.
🎯 Why mapping exposes hidden waste
Work feels efficient from inside a department because employees can see their own tasks. They usually cannot see the waiting, handoffs, corrections, and duplicate checks that occur before or after those tasks.
A process map joins those fragments together. It may reveal that an employee spends five minutes entering information, but the item then waits two days for another team to notice it. The active work is not necessarily the main problem; the delay between activities may be.
Mapping also replaces assumptions with evidence. Rather than saying “finance always slows us down,” a team can identify the exact approval, missing information, or system limitation causing the delay.
🔎 Define the process boundary first
Before drawing anything, decide exactly where the process starts and ends. This is called setting the scope or boundary.
A process that is too broad becomes overwhelming. “Improve customer service” contains dozens of processes. A better boundary might be “handle a customer request for a billing correction, from first contact to confirmed resolution.”
Write a simple boundary statement:
- Start: what event triggers the process?
- End: what outcome confirms completion?
- Customer: who receives the output?
- Purpose: what result should the process deliver?
Clear boundaries prevent the group from drifting into related, but separate, problems.
👥 Identify the customer and the promised outcome
Every process has a customer, even if that customer is internal. A payroll process serves employees. A procurement process serves the teams that need goods or services. A recruiting process serves hiring managers and candidates.
Ask what the customer actually needs: speed, accuracy, clarity, compliance, customization, or some combination. This matters because a step that seems inefficient may be necessary to protect something the customer values.
For instance, verifying a bank-detail change may add time, but it can reduce fraud risk. Mapping is not about removing every step; it is about distinguishing necessary effort from avoidable effort.
🧾 Gather facts from the people doing the work
Useful maps are built with the people closest to the process. Managers may understand policy and targets, but frontline employees often know the workarounds, exceptions, and recurring information gaps that are not written down.
Use short interviews, observation, document reviews, and group workshops. Ask people to describe what happens in practice, including phrases such as “usually,” “if that fails,” and “sometimes we have to.” Those phrases often point directly to waste or risk.
It helps to create a psychologically safe discussion. If mapping is framed as a search for someone to blame, people will describe the official process rather than the real one.
🗺️ Choose a map that fits the question
Different maps answer different questions. Selecting a simple format first usually makes the exercise more useful than starting with specialist notation.
| Map type | Best use | What it shows well |
|---|---|---|
| High-level flowchart | Understanding the overall sequence | Major steps and decisions |
| Swimlane map | Studying responsibilities and handoffs | Who does each activity |
| Value stream map | Investigating time and flow | Work time, waiting time, queues |
| SIPOC | Defining a process quickly | Suppliers, inputs, process, outputs, customers |
| Detailed procedure map | Standardizing complex work | Instructions, exceptions, controls |
For most improvement projects, begin with a high-level flowchart or swimlane map. Add detail only where the evidence suggests a problem.
🏊 Use swimlanes to reveal handoffs
A swimlane map divides the process into horizontal or vertical lanes for roles, teams, or systems. Each activity is placed in the lane of the person or group responsible for it.
This is especially helpful when work crosses functions. A request may move from sales to operations to finance and back to sales before the customer receives an answer. Each handoff can introduce waiting, misunderstanding, or lost ownership.
Do not assign a separate lane to every job title unless it adds insight. Grouping related roles can keep the map readable while still showing where responsibility changes.
🧩 Start with the current state, not the ideal state
The current-state map records how the process operates now, including detours and exceptions. It is tempting to draw the process people wish existed, particularly when policy documents describe a cleaner version.
That temptation weakens the analysis. If staff re-enter customer data because two systems do not connect, show the re-entry. If approvals happen through informal chat messages, show that too.
An ideal future-state map is valuable later. First, the team needs an honest baseline from which to improve.
🔤 Use clear symbols and plain language
Consistency matters more than sophisticated diagram symbols. A reader should be able to follow the map without needing a separate course in process notation.
- Use a rounded shape or clear label for the start and end.
- Use boxes for activities, beginning with active verbs such as “Check stock” or “Send invoice.”
- Use diamonds for genuine decisions, such as “Is the information complete?”
- Use arrows to show direction of flow.
- Use notes or labels for systems, forms, rules, or timing data.
A good test is to ask someone unfamiliar with the work to explain the map back to you. If they cannot trace it, simplify it.
⏱️ Separate touch time from elapsed time
Touch time is the time someone actively spends doing a task. Elapsed time, sometimes called lead time, is the total time from the start of a step or process until completion, including waiting.
Suppose an invoice correction needs ten minutes of staff effort but takes four business days to finish. The business should not conclude that the process only takes ten minutes. The customer experiences four days.
Recording both measures changes the improvement conversation. Automation may reduce touch time, but a redesigned queue or clearer ownership may reduce elapsed time far more.
⌛ Record waiting, queues, and aging work
Waiting is often invisible because no one is actively working during it. Yet waiting can create missed deadlines, customer frustration, rushed work at the end of a cycle, and a growing backlog.
On the map, mark where work sits: in an inbox, on a spreadsheet, in an approval queue, with a supplier, or waiting for missing details. Note whether there is a rule for checking the queue and who owns the next action.
Also look for aging work: items that remain open longer than normal. Averages can hide this problem, because a few very old cases may be balanced by many easy ones.
🔁 Find rework loops and error correction
Rework occurs when work must be corrected, repeated, clarified, or returned to an earlier stage. It is a strong signal that the process is not producing a reliable output the first time.
Imagine a purchasing team regularly sends requisitions back because cost codes are missing. The apparent waste is the return email. The underlying cause may be a confusing form, insufficient training, or a system that allows incomplete requests.
Draw feedback loops visibly. A loop from “Review request” back to “Request information” can reveal a hidden cycle repeated many times each week.
📥 Examine inputs before blaming downstream teams
Many process failures begin with weak inputs. A customer-support agent cannot provide an accurate answer if the case record lacks account history. A warehouse cannot pick correctly if the order data is unclear.
For each major input, ask:
- Who provides it?
- What information or material must be complete and accurate?
- How is quality checked?
- What happens when it is missing or inconsistent?
Improving the input often removes more waste than adding another downstream review. It prevents defects rather than detecting them later.
💻 Map systems, spreadsheets, and manual transfers
Processes rarely live in one system. Information may move from a customer portal to email, then to a spreadsheet, a finance platform, and a shared drive. Each transfer creates a chance for delay, version confusion, or data-entry error.
Mark the system used at each step and identify where people copy, paste, download, upload, print, or reconcile information. These actions are not always unnecessary; sometimes they are needed because systems serve different purposes.
However, repeated manual transfer deserves attention. It may be a candidate for integration, a redesigned form, shared access, or simply a clearer source of truth.
💸 Classify work by the value it creates
A practical way to spot waste is to classify each activity according to its relationship with customer value and business need.
Three useful categories
- Value-adding work: directly helps create the outcome the customer needs, such as repairing a product or preparing a tailored service.
- Necessary non-value-adding work: does not directly create customer value but may be required for legal, safety, financial, contractual, or risk-control reasons.
- Non-value-adding work: consumes effort without improving the output or meeting a legitimate requirement, such as duplicate data entry caused by poor design.
This classification should be applied carefully. A control may look unproductive until the team understands the risk it manages. The goal is informed challenge, not indiscriminate cutting.
🚚 Look for common forms of operational waste
Many improvement teams use categories of waste as prompts. They are not a substitute for evidence, but they help people notice patterns that routine work has made familiar.
- Waiting: work paused for approval, information, capacity, or a decision.
- Overprocessing: more checks, formatting, reporting, or data collection than the outcome requires.
- Defects: errors that need correction, investigation, or compensation.
- Excess handoffs: work passed between people without a clear reason.
- Searching and motion: time spent locating files, records, tools, or the right contact.
- Overproduction: reports, stock, or analysis created before anyone needs them.
In office work, waste often appears as information handling rather than physical movement. A spreadsheet that five people update separately can be as wasteful as an unnecessary trip across a factory floor.
🛑 Test approvals and controls, not just tasks
Approvals are a frequent source of delay, especially when they have accumulated after past mistakes or organizational changes. A map can reveal approval layers that no longer match the level of risk.
Ask what decision each approval makes, what authority is being exercised, and whether the approver has the information needed to make a useful judgment. An approval that is routinely automatic may be a notification disguised as a control.
Do not remove controls casually. Instead, consider alternatives: threshold-based approval, clearer delegated authority, periodic audit, automated validation, or exception-only review.
⚖️ Measure cost without pretending every minute is equal
Time has a cost, but calculating it requires judgment. An hour saved in a process does not automatically become an hour of cash savings; the organization may use that capacity to improve service, handle more volume, or reduce overtime instead.
Still, mapping can support sensible estimates. Consider labor effort, external fees, error correction, expedited shipping, discounts given to resolve failures, inventory holding, and lost opportunities caused by slow response.
State assumptions plainly. A transparent estimate is more useful than an overly precise calculation built on weak data.
📊 Use data to validate what the map suggests
A map produces hypotheses: “Most delay appears to happen at this approval,” or “Incomplete forms seem to drive rework.” Validate those ideas using available operational data, sample reviews, timestamps, queue reports, or direct observation.
Look beyond averages. Median time, ranges, backlog size, first-time-right completion, error types, and the volume of exceptions can reveal patterns an average conceals.
If data is incomplete, say so. A short period of structured observation may be enough to confirm whether a suspected bottleneck is real before investing in a larger solution.
🧱 Identify the real bottleneck
A bottleneck is the point that limits the flow of the overall process. It may be a person with specialist knowledge, a slow system, a scarce machine, a policy requirement, or a queue that peaks at a predictable time.
The busiest team is not automatically the bottleneck. A team can be busy but have enough capacity, while a small approval queue silently holds up every case.
Follow the work and examine accumulation. Where does work pile up? Which step determines how quickly the whole process can finish? Improvements away from that constraint may make local work easier without improving the customer’s experience.
🔀 Distinguish normal flow from exceptions
Many maps become unreadable because every possible exception is added to the main path. Start by drawing the normal, most frequent route through the process.
Then document material exceptions separately: urgent cases, failed payments, incomplete applications, regulatory checks, system outages, or customer complaints. An exception deserves attention when it is frequent, costly, risky, or disruptive.
Exception handling can reveal a deeper design issue. If “exceptions” occur often, they may no longer be exceptional; the standard process may be poorly matched to real demand.
🧠 Ask “why” until the cause is actionable
Seeing waste is only the beginning. A delay labelled “waiting for manager” does not explain why the manager is needed, why requests arrive incomplete, or why the decision cannot be delegated.
Use repeated, evidence-based “why” questions to explore causes. For example, orders may be corrected because a product code is wrong; the code is wrong because a sales catalogue is outdated; the catalogue is outdated because ownership for updates is unclear.
Stop when the team reaches a cause it can influence and verify. The purpose is not to interrogate individuals, but to understand the conditions producing the problem.
🛠️ Design improvements around the cause
Solutions should match the source of waste. If errors begin with incomplete information, an additional final inspection may catch defects but will not prevent them. A required field, clearer instruction, or better intake conversation may work better.
Common improvement options include:
- Remove a step that has no customer, business, or control purpose.
- Combine related activities handled separately without benefit.
- Sequence work differently to reduce waiting.
- Standardize a routine task with a checklist or template.
- Automate stable, rule-based work after simplifying it.
- Route complex cases to skilled staff while allowing simple cases to flow quickly.
Be cautious about automating a flawed process. Technology can make poor work move faster, but it can also make waste more difficult to see and change.
🧪 Pilot changes before broad rollout
A process change affects people, customers, systems, and controls. A small pilot lets the organization test whether the proposed future state works under real conditions.
Define the pilot group, duration, responsibilities, measures, and fallback plan. Compare results with the baseline while also gathering feedback from employees and customers affected by the new flow.
A pilot may show that a change works for standard cases but creates problems for unusual ones. That is useful learning, not failure; it prevents a weak design from being scaled too quickly.
📈 Track measures that reflect the intended outcome
Choose a small set of measures tied to the problem the team is solving. If the goal is faster response, track elapsed time and the share of cases meeting the agreed target. If the goal is better quality, track first-time-right completion and recurring error reasons.
Balance speed with quality and control. Reducing handling time is not a genuine improvement if complaints, safety risks, or compliance failures rise as a result.
Make ownership clear. A metric without a named reviewer and a regular review point is likely to become a report rather than a management tool.
🗣️ Involve people in the future-state map
Employees are more likely to use a new process when they understand why it changed and have contributed practical knowledge to its design. Involvement also exposes consequences that a project team may miss.
Explain what will change in roles, training, decision rights, workload, systems, and escalation paths. If an activity is removed, clarify who handles the work that genuinely still needs doing.
Process improvement is not simply diagram work. It is a change in how people coordinate, make decisions, and respond when something falls outside the normal path.
📚 Document the new standard without creating bureaucracy
After a successful change, update the process map, procedures, templates, system guidance, and training materials. Otherwise, new employees may learn an outdated method and the process can gradually return to its earlier state.
Documentation should be proportionate. A short visual guide may be enough for a simple routine, while a high-risk or regulated process may require more detailed instructions and evidence of completion.
Include ownership, inputs, expected output, decision rules, escalation points, and the date of the latest review. A map is most useful when it remains a living reference.
⚠️ Avoid common process-mapping mistakes
Several mistakes repeatedly reduce the value of mapping work. The first is mapping in isolation: one analyst cannot reliably reconstruct a cross-functional process from documents alone.
Another is treating every box as equally important. Focus analysis on high-volume, high-cost, high-risk, or customer-critical points rather than debating minor wording in a diagram.
Other traps include:
- Using the map to assign blame rather than improve the system.
- Ignoring informal workarounds that keep the process moving.
- Jumping to software purchases before understanding the cause.
- Removing controls without assessing the risk they address.
- Creating a future-state map but never testing or maintaining it.
🔄 Review processes as conditions change
A process that worked well last year may become inefficient after new products, regulations, systems, customer expectations, remote-work arrangements, or changes in volume. Process maps should therefore be reviewed when meaningful conditions change, not only when performance has already deteriorated.
Review is especially useful after a major incident or repeated customer complaint. Rather than merely reminding people to “be more careful,” trace the process and ask what design feature allowed the failure to occur or persist.
Regular review does not require a full redesign every time. Small adjustments can prevent a temporary workaround from becoming permanent hidden complexity.
✅ The core principle: make work visible before changing it
Business process mapping turns a vague frustration into a shared description of work. It shows where an item starts, who touches it, where it waits, what information it needs, which rules govern it, and what the customer receives at the end.
The strongest maps combine employee knowledge with observable facts. They distinguish touch time from waiting, useful controls from habit, and root causes from symptoms. They also recognize that faster is not always better if quality, safety, fairness, or compliance is damaged.
When teams use the map to ask better questions—not to defend territories or blame individuals—they can remove friction while protecting the parts of the process that genuinely create value.
The practical lesson is simple: map the real flow of work, measure where it stalls or repeats, and improve the causes of waste rather than merely speeding up the symptoms. 📋⏱️✅