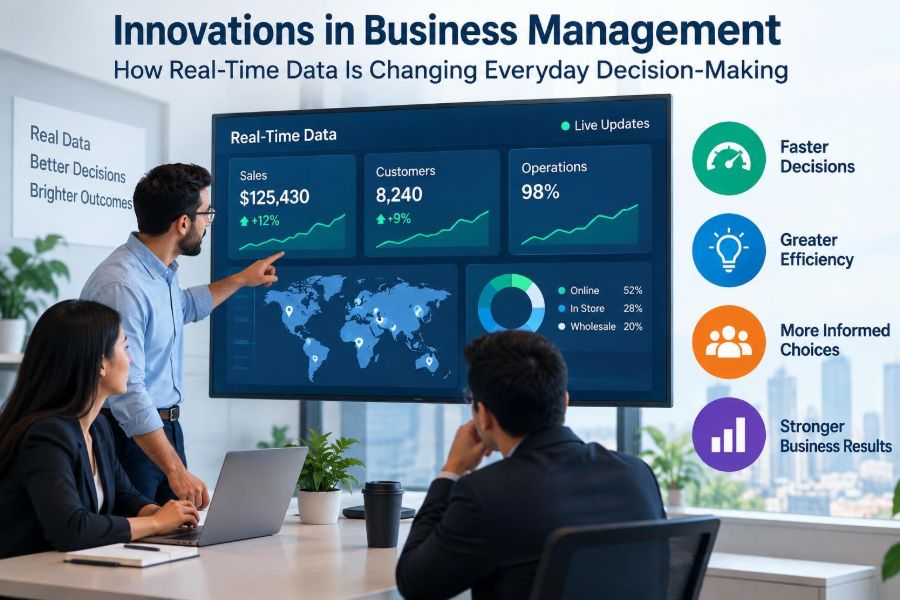

A store manager notices that a popular product is selling unusually quickly before lunch. Rather than waiting for an end-of-day report, she checks a live dashboard, asks a nearby location to transfer stock, and adjusts the afternoon staffing plan. By closing time, fewer customers have left empty-handed.
A project leader has a different problem: several tasks appear “on track,” yet the team’s work queue is growing. A current view of handoffs reveals that one approval step has become a bottleneck. The leader can investigate while there is still time to change priorities.
These are ordinary management situations, not futuristic ones. What has changed is the speed at which useful operational signals can reach the people responsible for acting on them.
Real-time data can make decisions more responsive, but it does not make them automatically better. Its value depends on choosing meaningful measures, understanding context, and building sensible routines around the information.
📡 What Real-Time Data Actually Means
Real-time data is information made available soon enough to influence the decision it describes. “Soon enough” varies by context: a delivery delay may need attention within minutes, while a monthly workforce trend may be perfectly useful when reviewed weekly.
It is not simply data displayed on a screen. A live sales total, a machine sensor reading, an updated customer support queue, and a current project status can all be real-time if the data is refreshed quickly and can trigger relevant action.
⏱️ Speed Is Useful Only at the Right Moment
Managers often assume faster is always better. In reality, speed has a cost: more frequent collection, integration, monitoring, and alerts can create complexity without improving a decision.
The practical question is not “Can we see this instantly?” but “What decision changes if we see it earlier?” If a manager cannot reasonably act until the next weekly planning meeting, a minute-by-minute update may be noise rather than insight.
🧩 From Historical Reports to Live Operations
Traditional reports explain what happened after a period closes. They remain valuable for budgeting, performance review, audits, and longer-term planning. Real-time systems add a different capability: they help teams respond while an event is still unfolding.
A useful distinction is between recording the past and managing the present. Mature organizations need both. A daily sales report may reveal a pattern, while a live inventory view helps prevent a stockout this afternoon.
🔄 The Data-to-Decision Loop
Real-time management works as a loop rather than a one-way report. Data is captured, checked, interpreted, acted upon, and then observed again to see whether the action helped.
- An event occurs, such as a new order, delayed shipment, or customer complaint.
- A system records and updates the relevant information.
- A person or automated rule identifies whether attention is needed.
- The business takes an action, such as rerouting work or contacting a customer.
- The next data update shows the resulting condition.
Weakness at any point can break the loop. Fast data is of little value when responsibility for acting is unclear.
📊 Dashboards Turn Streams into a Shared View
A dashboard combines selected measures into a view that helps people understand current conditions. It might show open orders, available capacity, service response times, cash movement, or campaign performance.
The best dashboards answer a focused operational question. A warehouse supervisor may need exceptions by delivery route; a senior leader may need a compact view of demand, capacity, and risk. One crowded dashboard rarely serves both audiences well.
🎯 Metrics Must Connect to a Decision
A metric becomes useful when a manager knows what it represents, what range is normal, and what action is available when it changes. “Website visits” may be interesting; “checkout errors rising for mobile users” points more directly toward investigation.
Before adding a live measure, teams should define its decision link:
- What is being measured?
- Who reviews it and how often?
- What condition requires attention?
- What action can that person take?
- What outcome will show whether the action worked?
This discipline prevents dashboards from becoming decorative collections of numbers.
🚦 Leading and Lagging Indicators Serve Different Jobs
Lagging indicators describe results that have already occurred, such as completed sales, monthly profit, or customer churn. They are necessary for judging outcomes, but they may arrive too late to prevent a problem.
Leading indicators are earlier signals that may influence future results, such as an increasing backlog, declining stock availability, or a rise in unresolved service tickets. They are not guarantees; they are prompts to ask better questions.
| Type | Example | Management use |
|---|---|---|
| Leading indicator | Orders waiting beyond the normal time | Adjust staffing or investigate a bottleneck |
| Lagging indicator | Monthly late-delivery rate | Assess whether operational changes improved service |
🛒 Retail Decisions Become More Responsive
Retailers can combine point-of-sale activity, inventory updates, online orders, and staffing information to see current demand. This can support replenishment, queue management, promotion adjustments, and store-to-store transfers.
Consider a hypothetical café that sees an unexpected rush after a local event. A current view of sales and ingredient levels can help the manager prepare another batch or temporarily simplify the menu. The data does not replace judgment about customer experience, but it makes the trade-off visible sooner.
🏭 Operations Teams Can See Bottlenecks Earlier
In manufacturing, logistics, and service operations, delays often form where work waits between steps. Live information can reveal whether a machine is idle, a quality check is backing up, or deliveries are arriving later than planned.
Managers should avoid treating every deviation as a crisis. Variation is normal. The aim is to identify patterns that exceed an agreed threshold and then distinguish a one-off interruption from a recurring constraint.
👥 Workforce Management Needs Context, Not Surveillance
Current scheduling, workload, attendance, and queue information can help managers distribute work more fairly and prevent teams from becoming overloaded. In a contact center, for example, live demand may justify moving trained employees to a busy channel.
However, people data is sensitive. Monitoring should be proportionate to the work, clearly explained, and used to support performance rather than create constant pressure. Measuring activity is not the same as measuring contribution, creativity, or good judgment.
💬 Customer Service Can Recover Problems Faster
Support teams benefit when they can see incoming requests, service outages, repeat contacts, and unresolved cases as they develop. A sudden cluster of similar messages may signal a product fault or a confusing change before it becomes widely visible.
Real-time information also supports better communication. If a team knows which orders are affected by a delay, it can contact customers proactively instead of waiting for complaints. That is often more useful than merely reducing the average response-time number.
💰 Finance Gains a Current Cash Picture
Finance teams have long relied on carefully controlled reporting cycles, and those controls still matter. Yet current data on payments received, invoices due, purchase commitments, and sales activity can improve short-term cash visibility.
A live cash view should not be mistaken for a final financial statement. Timing differences, incomplete records, and approval processes can affect what the figures mean. It is best used for operational awareness alongside formal accounting procedures.
📣 Marketing Can Test and Adjust While Campaigns Run
Digital channels can provide current signals about traffic, inquiries, conversions, and customer behavior. Teams may use these signals to pause a clearly malfunctioning advertisement, redirect budget, or improve a confusing landing page.
Early numbers need caution. A small amount of activity can fluctuate sharply, and an immediate rise in clicks does not necessarily mean a campaign is creating valuable customers. Managers should connect campaign data to quality, cost, and longer-term outcomes.
📦 Supply Chains Depend on Timely Exceptions
Supply chains involve suppliers, transport providers, warehouses, stores, and customers. Because each link affects the next, delays can compound quickly. Current shipment locations, expected arrival times, inventory positions, and supplier updates help teams manage exceptions.
The goal is not to micromanage every parcel. It is to focus attention on events with meaningful consequences: a delayed component that may stop production, a temperature alert for sensitive goods, or a late delivery affecting a major customer commitment.
🔗 Integration Creates the Bigger Picture
Useful decisions often require information from more than one system. Sales data without inventory can encourage promises that cannot be fulfilled; staffing data without demand can lead to poor coverage decisions.
Data integration connects information across systems so that related events can be analyzed together. This may involve customer relationship tools, enterprise resource planning systems, payment platforms, sensors, and spreadsheets. Integration is valuable, but it also exposes mismatched definitions and duplicate records that must be resolved.
🧹 Data Quality Is a Management Responsibility
Fast inaccurate data can lead to fast bad decisions. Common problems include missing entries, duplicate customers, delayed updates, inconsistent product names, and staff using different meanings for the same status.
Improving quality is not only a technical task. Managers need clear definitions, accountable owners, simple processes for correction, and regular checks. If “order completed” means different things to sales, warehouse, and finance teams, no dashboard can provide a reliable shared picture.
⚠️ Alerts Should Prioritize, Not Interrupt Constantly
Alerts are useful when they bring an unusual or consequential condition to the right person. They become harmful when people receive so many notifications that they begin ignoring all of them.
Good alert design considers severity, timing, and ownership. A minor deviation might appear in a daily review, while a safety-related or customer-critical issue may need immediate escalation. Each alert should have a clear recipient and a practical next step.
🤖 Automation Handles Repeatable Responses
Some real-time decisions can be automated safely when the rules are clear and the consequences are limited. A system might reorder a routinely used item within approved limits, assign incoming tickets by topic, or flag a transaction for review.
Automation is strongest for repeatable tasks with well-defined inputs. It is weaker when circumstances are novel, information is incomplete, or the decision involves fairness, trust, reputation, or significant financial consequences. Human oversight remains essential in those cases.
🧠 Human Judgment Explains What Numbers Cannot
Data can show that demand fell; it may not explain whether a competitor changed prices, a customer segment had a temporary issue, or a tracking system failed. Managers add context through conversations, operational knowledge, and awareness of external events.
A sound practice is to treat a dashboard as the start of inquiry, not the end of it. Ask what changed, which data could be incomplete, who is closest to the work, and what unintended effect a proposed response might create.
🪟 Decision Rights Prevent Confusion
When a live metric crosses a threshold, teams need to know who can act. Without defined decision rights, employees may wait for approval, duplicate effort, or make conflicting changes.
For each important real-time workflow, clarify who monitors the signal, who investigates it, who has authority to respond, and when escalation is required. This is especially important across departments, where the person seeing a problem may not control the resource needed to solve it.
🧪 Start with a Narrow, Valuable Use Case
Organizations sometimes begin by purchasing a dashboard platform and then searching for reasons to use it. A better approach is to begin with a persistent operational problem: late order handoffs, avoidable stockouts, long approval queues, or missed service commitments.
Choose one process where faster visibility could change a real decision. Define the measure, baseline performance, action owner, and review period. A small pilot exposes data gaps and workflow issues before the organization attempts a broad rollout.
📏 Set Thresholds with Care
A threshold is the point at which a metric calls for attention. It should reflect operational reality, not an arbitrary desire for a neat red-and-green dashboard. Thresholds may differ by product, location, season, customer type, or time of day.
Teams should revise thresholds as they learn. If an alert fires repeatedly without requiring action, it may be too sensitive. If a serious issue is routinely discovered before the alert appears, the threshold or underlying data may be inadequate.
🔍 Test Assumptions Before Scaling a Response
A real-time signal can encourage rapid action, but rapid does not mean impulsive. Before expanding staff, changing prices, or contacting customers, managers should confirm that the pattern is genuine and not caused by a system outage, duplicate feed, or unusual one-time event.
Where risk is moderate, a limited response can be sensible. A manager might shift one team member, test one message, or hold a small amount of stock back while gathering more evidence. This preserves agility without overreacting.
⚖️ Privacy, Security, and Fairness Cannot Be Added Later
Live data may include customer behavior, location, employee activity, payment information, or commercially sensitive operations. The more timely and connected the data, the greater the need for careful access controls and clear governance.
Organizations should collect only what is necessary, restrict access by role, protect systems appropriately, and explain monitoring practices transparently. They must also examine whether automated rules disadvantage particular groups or reproduce biased historical patterns. Legal obligations vary by location and industry, so specialized advice may be needed.
📉 Beware of False Precision and Metric Gaming
A real-time number can look objective even when it is incomplete or poorly defined. If a dashboard reports a service level to two decimal places, that display may imply accuracy beyond what the underlying process supports.
Metrics can also change behavior in unhelpful ways. If employees are judged only on call duration, they may rush customers rather than solve problems. Balance speed metrics with quality checks, customer outcomes, and qualitative feedback.
🌊 Avoid Managing by Every Small Fluctuation
Most operations naturally rise and fall. Managers who react to every movement can create instability: unnecessary schedule changes, inconsistent priorities, and teams that feel constantly redirected.
Look for meaningful variation relative to normal patterns. Trend lines, comparison with a relevant baseline, and discussion with frontline staff are often more informative than a single live reading. Real-time management should improve calm coordination, not create permanent urgency.
📚 Build Data Literacy Across the Team
Data literacy is the ability to read, question, and use data responsibly. It includes understanding definitions, recognizing limitations, interpreting basic trends, and knowing when a number needs further investigation.
Training should be practical. Teams can review real examples of misleading charts, discuss what a metric excludes, and practice turning an alert into a good operational question. Managers set the tone when they reward thoughtful interpretation instead of demanding instant certainty.
🗺️ Create a Practical Implementation Roadmap
A workable real-time data initiative usually develops in stages:
- Identify a decision that is currently too slow, inconsistent, or poorly informed.
- Map the process, data sources, owners, and likely exceptions.
- Agree on definitions, a small set of measures, and appropriate refresh timing.
- Build a pilot view and test it with the people doing the work.
- Set actions, escalation routes, controls, and feedback routines.
- Review outcomes, improve data quality, and expand only where value is clear.
This sequence keeps technology connected to management practice rather than treating it as a separate project.
🌱 The Core Principle: Faster Information, Better Judgment
Real-time data changes everyday decision-making because it reduces the gap between an event and a manager’s ability to notice, understand, and respond. It can improve service, coordination, capacity use, and resilience when the information is trustworthy and the response is well designed.
But the central advantage is not speed alone. It is the combination of timely signals, shared definitions, accountable people, proportional automation, and human judgment. A dashboard should help teams see the right question sooner—not pressure them to act before they understand it.
Organizations gain the most from real-time data when they use it to support thoughtful action rather than replace thoughtful management. Start with a meaningful decision, learn from the workflow around it, and let the system earn its place in daily work. 📊🧠🤝