
A store can look busy while quietly tying up too much cash in products that are not moving. At the same time, a nearly empty warehouse can signal disciplined operations—or missed sales because customers cannot find what they want.
Inventory turnover helps managers look past the shelf count and ask a more useful question: how efficiently is a business converting inventory into sales? It connects purchasing, pricing, demand, cash flow, and customer service in one practical measure.
For a student learning financial analysis or a professional responsible for stock, the ratio is easy to calculate. Interpreting it well takes more care. A “high” number is not automatically good, and a “low” number is not automatically bad.
The real value of inventory turnover is the conversation it starts: Which goods are moving, how much capital is committed, and what should the business change next?
📦 What Inventory Turnover Measures
Inventory turnover measures how many times a business sells and replaces its average inventory during a period. It is usually calculated for a year, quarter, or month.
Think of a café buying coffee beans, using them to make drinks, then buying more beans. Each complete cycle of selling through a typical amount of stock and replenishing it contributes to turnover.
The ratio focuses on the cost of goods sold rather than the selling price of products. That alignment makes the comparison more meaningful because inventory is generally recorded at cost on the balance sheet.
🧭 Why Managers Pay Attention to It
Inventory often represents a major use of working capital: the cash a business needs for everyday operations. Money held in unsold stock cannot be used to pay suppliers, invest in equipment, reduce debt, or respond to an opportunity.
A turnover trend can reveal whether stock levels are keeping pace with demand. It can also expose potential overbuying, weak product selection, forecasting problems, pricing issues, or supply disruptions.
For lenders and investors, the ratio offers one window into operating efficiency. It should never be judged alone, but it can help explain why cash flow differs from reported sales or profit.
🧮 The Basic Inventory Turnover Formula
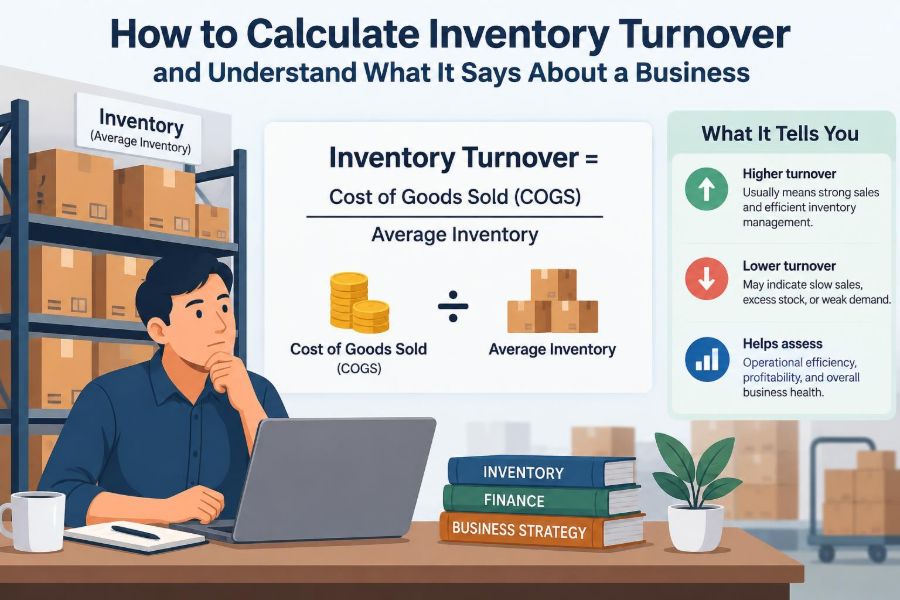
The standard formula is:
Inventory Turnover = Cost of Goods Sold ÷ Average InventoryCost of goods sold (COGS) is the direct cost of the products a business sold during the period. For a retailer, it is primarily the cost paid for merchandise. For a manufacturer, it may include materials, direct labor, and allocated production costs, depending on its accounting approach.
Average inventory estimates the typical amount of inventory held during that same period. Using an average is usually more informative than using one closing inventory figure.
📚 Finding Cost of Goods Sold
COGS commonly appears on an income statement. It may also be called cost of sales, cost of revenue, or cost of products sold.
If it is not given directly, a simplified inventory equation can help:
COGS = Beginning Inventory + Purchases − Ending InventoryThis equation assumes the figures are consistently measured and adjusted for relevant items such as purchase returns. In practice, financial statements and accounting systems may incorporate additional details.
Do not substitute total sales revenue for COGS in the standard turnover formula. Sales include the markup charged to customers, while inventory is valued at cost. Mixing them can overstate the ratio.
⚖️ Calculating Average Inventory
The most common calculation is:
Average Inventory = (Beginning Inventory + Ending Inventory) ÷ 2Suppose a business starts the year with $80,000 of inventory and ends with $120,000. Its average inventory is $100,000.
This is a useful approximation when inventory levels are fairly stable. But businesses with dramatic seasonal swings should consider a more detailed average based on monthly or weekly inventory balances.
🔢 A Straightforward Calculation Example
Consider a hypothetical home-goods retailer. Its annual COGS is $600,000. Beginning inventory is $90,000 and ending inventory is $110,000.
- Average inventory = ($90,000 + $110,000) ÷ 2 = $100,000
- Inventory turnover = $600,000 ÷ $100,000 = 6
The retailer turned over its average inventory six times during the year. That means it sold goods costing roughly six times its typical inventory investment, not that every individual product sold exactly six times.
📅 Converting Turnover Into Days Inventory Outstanding
A turnover ratio can feel abstract. Converting it into an estimated number of days makes it easier to discuss operationally.
Days Inventory Outstanding = Number of Days in Period ÷ Inventory TurnoverUsing the retailer’s turnover of 6, the estimate is 365 ÷ 6, or about 61 days. In broad terms, the business holds inventory for about 61 days before selling it.
This measure is also called days inventory on hand or inventory days. It is an average, not a promise that each item will remain in stock for that exact number of days.
🕒 Choosing the Right Time Period
The numerator and denominator must cover comparable periods. Annual COGS should be paired with average inventory from that year; quarterly COGS should be paired with inventory balances relevant to that quarter.
Monthly turnover is useful for operational monitoring, especially in retail and food service. Annual turnover is useful for broad financial review but can hide short-term stockouts or seasonal buildup.
When comparing periods, be consistent. A ratio calculated for one month is not directly comparable with a ratio calculated for a full year unless it is annualized carefully and the reader understands the limitation.
🏪 Why a Good Turnover Rate Depends on the Industry
There is no universal “ideal” inventory turnover. A grocery store selling perishable staples will usually operate differently from a furniture retailer, industrial equipment distributor, luxury jeweler, or auto-parts supplier.
Products with short shelf lives, predictable demand, and frequent replenishment may turn quickly. High-value, customized, seasonal, or slow-purchase products may turn more slowly by design.
| Business characteristic | Likely turnover pattern | Why |
|---|---|---|
| Perishable everyday goods | Often faster | Freshness and frequent customer purchases limit long holding periods. |
| Seasonal merchandise | Uneven through the year | Stock may build before the selling season and decline afterward. |
| High-value durable goods | Often slower | Customers buy less frequently and each unit ties up more capital. |
| Critical replacement parts | Potentially slower | Availability may matter more than rapid movement. |
A useful comparison is usually with the business’s own prior periods, direct competitors with similar models, and realistic operating targets.
📈 What High Inventory Turnover Can Suggest
High turnover often means inventory is selling efficiently relative to the amount held. It can reduce storage needs, shrink the risk of obsolescence, and free cash for other uses.
It may also reflect strong demand, effective merchandising, accurate forecasting, disciplined purchasing, or a business model built around rapid replenishment.
However, high turnover is only favorable when customers can still buy what they want. A ratio can rise because a business is understocked, losing sales, and repeatedly running out of popular items.
📉 What Low Inventory Turnover Can Suggest
Low turnover means inventory is moving slowly relative to the average stock investment. It may indicate excess purchasing, weak demand, an outdated product range, poor pricing, or inadequate sales activity.
Slow-moving inventory creates carrying costs. These can include warehouse space, insurance, handling, financing costs, damage, deterioration, and the possibility that goods become obsolete or need to be discounted.
Still, a lower rate can be sensible. A distributor may deliberately hold more stock to deliver reliably to customers, and a business preparing for a predictable peak season may temporarily show lower turnover.
🚨 When Very High Turnover Is a Warning Sign
Managers should investigate unusually high turnover rather than automatically celebrate it. Inventory that is too lean can create stockouts, rushed purchasing, costly expedited shipping, and frustrated customers.
Frequent stockouts may not appear clearly in the turnover formula. Sales can look healthy even though they would have been higher if products had been available.
- Are customers leaving because key items are unavailable?
- Are employees substituting less suitable products?
- Are suppliers being asked for emergency deliveries?
- Has the business lost a buffer needed for demand variability?
Service level and lost-sales data provide necessary context.
🧊 The Hidden Cost of Slow-Moving Stock
Not all inventory becomes worthless, but older stock deserves attention. Fashion, technology, food, and trend-sensitive products can lose value quickly; industrial supplies may remain usable longer but still consume space and cash.
Slow stock can also hide management problems. A business may keep ordering an item because it has always carried it, even when sales patterns no longer justify the quantity.
Reviewing inventory by age and product category helps distinguish a healthy assortment from a warehouse filled with dormant items.
🧩 Look Beyond the Company-Wide Average
A single turnover ratio can conceal major differences across products. Fast-selling basics and obsolete specialty goods can average into a number that looks acceptable.
Segment the analysis where practical:
- Product category or brand
- Store, region, warehouse, or sales channel
- Customer segment
- Seasonal versus year-round items
- New, core, and end-of-life products
This analysis supports better decisions because replenishment, discounting, and purchasing should rarely be identical for every item.
🧱 The Role of Inventory Valuation Methods
Accounting methods can affect COGS, ending inventory, and therefore turnover. Common methods include FIFO, which assumes earlier costs are sold first, and weighted average cost, which spreads cost across units.
When purchase costs change, two otherwise similar businesses using different permitted methods may report different inventory values and turnover ratios. This matters when comparing financial statements.
The operational question—how quickly products physically move—remains valuable, but reported financial ratios should be interpreted with awareness of accounting policy.
🌦️ How Seasonality Can Distort the Result
A holiday retailer may build inventory for months before its peak selling period. If its year-end balance happens to be low after strong holiday sales, using only beginning and ending inventory can understate the stock held during the year.
Likewise, a business ending a period with a large pre-season purchase may appear to have weak turnover even if that inventory is planned and likely to sell soon.
Monthly averages provide a more representative picture when inventory rises and falls sharply. Managers should also compare the same season across years rather than relying only on annual totals.
💰 Pricing, Discounts, and Turnover
Pricing affects demand and therefore inventory movement. A discount can help clear aging goods, improve cash recovery, and make room for products with better prospects.
But clearing stock at a steep discount can reduce gross margin, the amount left after COGS is deducted from sales. A higher turnover ratio does not automatically mean stronger profitability.
The practical question is whether the business earns an acceptable return from the inventory investment. Turnover and margin should be evaluated together.
📊 Pairing Turnover With Gross Margin
Some businesses sell quickly at low margins; others sell more slowly at higher margins. Either model can work if the economics support overhead, financing, and an appropriate return.
For example, a discount retailer may accept modest profit per item because it sells large volumes rapidly. A specialist retailer may carry expensive inventory longer but earn more on each sale.
A useful follow-up measure is gross margin return on inventory investment, often abbreviated GMROI. Its specific calculation and conventions can vary, but the central idea is simple: assess gross profit generated by inventory, not turnover alone.
💧 Connecting Inventory Turnover to Cash Flow
Buying inventory usually requires cash before a customer pays for the finished sale. Faster movement can shorten the time that cash is tied up, especially when supplier payment terms are favorable.
Yet cash flow depends on more than turnover. Credit sales create accounts receivable, while supplier terms create accounts payable. A business can turn inventory quickly and still face cash pressure if customers pay slowly.
For this reason, managers often examine inventory alongside receivables, payables, operating cash flow, and upcoming purchase commitments.
🔄 Inventory Turnover and the Operating Cycle
The operating cycle traces cash from purchasing inventory to collecting cash from customers. Inventory days are one part of that cycle.
A simplified view is:
Operating Cycle = Inventory Days + Receivables Collection DaysSubtracting the time taken to pay suppliers produces a cash conversion cycle. These measures help explain why inventory decisions influence liquidity, particularly for businesses that must pay suppliers well before they collect from buyers.
🏭 Manufacturers Need Extra Interpretation
Manufacturers may hold raw materials, work in process, and finished goods. Each stage can create a different bottleneck.
Rising raw-material inventory may reflect a deliberate strategy to protect production from supply risk. Rising work in process can point to production delays. Rising finished goods may indicate sales demand is weaker than expected.
A total inventory turnover ratio remains useful as a broad indicator, but stage-level analysis gives managers clearer operational clues.
🛒 Retailers and E-Commerce Businesses
Retailers typically focus heavily on SKU-level performance. A SKU is a stock-keeping unit: a distinct item tracked in the inventory system, such as a particular size, color, and model.
E-commerce operations must balance turnover with product availability across fulfillment locations. Stock may exist somewhere in the network but still be unavailable to a customer who needs quick delivery.
Returns require attention too. Returned products may be resalable, discounted, damaged, or pending inspection. Poor return handling can make recorded stock less useful than it appears.
🧾 Service Businesses May Have Little Inventory
Many service businesses carry little or no resale inventory. A consulting firm, for example, may have supplies but does not earn revenue by selling stock in the same way as a retailer.
Other service businesses do depend on inventory. Restaurants hold food and beverages; repair companies hold parts; salons hold retail products and consumables.
The metric is most meaningful when inventory is central to how the business earns revenue. Do not force it into an analysis where labor capacity, appointments, or project delivery are the real constraints.
🧠 Common Calculation Mistakes
Small inconsistencies can produce misleading results. Before interpreting a ratio, check the inputs and period.
- Using sales revenue instead of COGS without clearly labeling a nonstandard ratio
- Using ending inventory alone when stock changed materially during the period
- Mixing monthly COGS with annual inventory figures
- Comparing businesses with different inventory accounting methods or business models
- Ignoring consigned goods, returns, damaged stock, or goods in transit
- Treating a one-time clearance event as evidence of normal performance
Good analysis begins with clean, comparable data—not just a correct division calculation.
🔍 Investigating a Sudden Change in Turnover
A sharp change deserves a practical explanation. Start by asking whether COGS, inventory, or both changed, then trace the relevant drivers.
Possible causes include a demand shift, a new product launch, price changes, supplier delays, a purchasing policy change, a stock write-down, a new warehouse, or an accounting classification adjustment.
Break the trend into categories and months. A company-wide ratio might fall because one category is building for a launch, while the remainder of the business is improving.
🛠️ Improving Turnover Without Damaging Service
The goal is not simply to hold less inventory. The goal is to hold the right inventory in the right place at the right time.
- Improve demand forecasts using recent sales patterns and known events.
- Set reorder points that reflect lead times and demand variability.
- Reduce order quantities for uncertain or slow-moving items.
- Review supplier lead times and minimum-order requirements.
- Use targeted promotions for aging inventory before it loses more value.
- Remove duplicate, obsolete, or low-value assortment complexity where appropriate.
Changes should be monitored for unintended effects, particularly lost sales and lower customer satisfaction.
🤝 Supplier Relationships Matter
Reliable suppliers can allow a business to replenish more frequently and carry less buffer stock. Shorter, dependable lead times often improve the trade-off between turnover and product availability.
But relying on a single supplier or an extremely tight delivery schedule can increase risk. Supply disruption may leave a lean operation unable to serve customers.
Strong inventory planning considers supplier reliability, alternative sources, order flexibility, and the business consequences of running out of critical items.
🎯 Setting a Useful Internal Target
An internal target should reflect strategy rather than an arbitrary benchmark. Start with past performance, expected demand, product life cycles, supplier conditions, desired service levels, and cash constraints.
Targets can differ by category. Essential items may justify more safety stock, while experimental or highly seasonal products may need tighter purchase limits.
A target is most useful when paired with an owner, a review cadence, and a defined response if performance moves outside an acceptable range.
📋 A Practical Review Routine
Inventory turnover becomes more useful when it is part of a regular operating routine rather than a year-end calculation.
- Calculate turnover and inventory days for the business and key categories.
- Compare results with prior comparable periods and planned targets.
- Identify the products creating the biggest cash or availability issues.
- Check margin, stockout, aging, and supplier information before acting.
- Choose specific actions: change orders, transfer stock, adjust prices, or revise forecasts.
- Review results and learn whether the action improved both cash use and service.
This cycle turns a financial ratio into a management tool.
🧾 What the Ratio Cannot Tell You Alone
Inventory turnover does not reveal customer satisfaction, product quality, supplier resilience, future demand, or whether a business is profitable. It also does not show whether inventory records match the physical stock on hand.
High turnover could result from excellent planning, aggressive discounting, shortages, or a temporary sales spike. Low turnover could result from poor buying, planned seasonal stock, or a deliberate availability strategy.
Use the ratio as a signal that prompts questions, not as a verdict on management quality.
✅ The Core Principle to Remember
Inventory turnover compares the cost of goods sold with average inventory to show how efficiently a business moves stock through its operations. The calculation is simple, but its meaning depends on product type, seasonality, margins, service expectations, supply conditions, and cash needs.
The most useful interpretation combines turnover with inventory days, category detail, gross margin, stockout information, and trend analysis. That broader view helps a business avoid two costly extremes: cash trapped in excess stock and revenue lost because shelves are empty.
Inventory turnover is most valuable not as a score to maximize, but as a decision-making signal for balancing availability, profitability, and cash. 📦📊