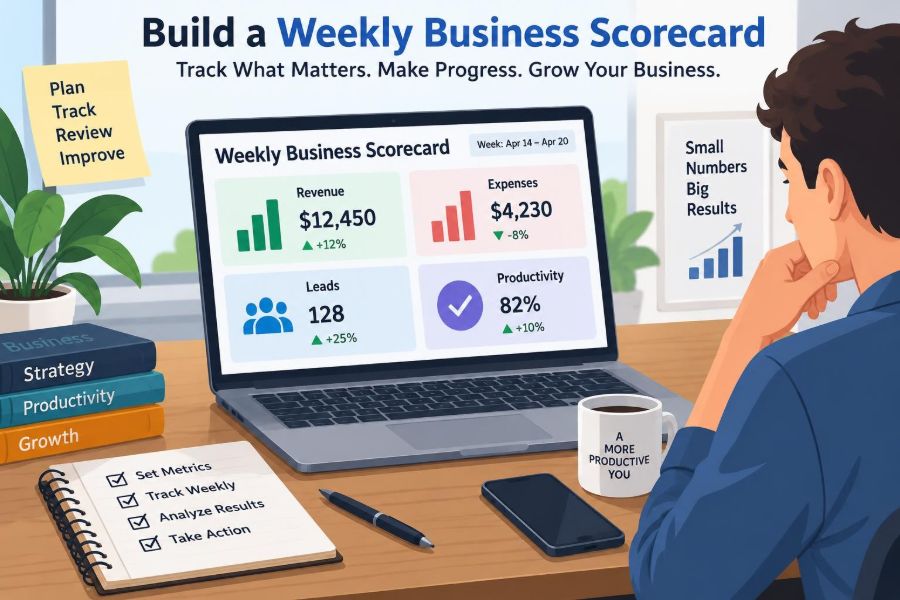

It is Friday afternoon. You know the week felt busy: customer messages kept arriving, the team completed urgent tasks, invoices went out, and there were plenty of meetings. But a simple question is hard to answer: did the business actually move forward?
Many small businesses and growing teams have data, but not visibility. Sales figures sit in one system, expenses in another, lead activity in a shared inbox, and productivity in task tools or individual memories. Looking at each source separately makes it easy to confuse activity with progress.
A weekly business scorecard brings a small set of signals into one regular conversation. It does not replace financial statements, customer research, or detailed operational reports. It gives managers a practical dashboard for noticing changes early enough to respond.
The goal is not to measure everything. It is to choose a few numbers that connect daily work with the business outcomes that matter: earning revenue, controlling spending, creating future demand, and delivering work reliably.
🧭 Start With the Decision, Not the Spreadsheet
A scorecard is useful only if someone uses it to make decisions. Before opening a spreadsheet, ask what decisions the weekly review should support. Examples include whether to follow up faster on leads, reduce discretionary spending, add capacity to a busy service, or investigate a falling sales conversion rate.
This question prevents a common problem: a crowded dashboard that reports interesting facts but does not prompt action. A good metric has an owner, a clear definition, and a plausible response when it moves.
Think of the scorecard as a vehicle dashboard. It cannot explain every mechanical detail, but it should warn you when speed, fuel, temperature, or direction needs attention.
🎯 Define the Business Outcome You Are Tracking
Most weekly scorecards sit beneath a broader business goal, such as improving cash stability, growing a customer base, or making delivery more predictable. Write that goal in plain language before choosing metrics.
For example, a consultancy seeking steadier growth may focus on qualified opportunities and signed work. A retailer may need to watch sales, gross margin, stock availability, and marketing response. A product team may need to pair revenue with adoption and delivery quality.
Metrics are indicators, not the strategy itself. Their job is to show whether the strategy is producing the intended result and where investigation is needed.
📅 Choose a Consistent Weekly Reporting Window
Decide exactly what “this week” means. Many organizations use Monday through Sunday and review the completed period on Monday or Tuesday. Others align with a payroll, sales, or operational cycle. Consistency matters more than the specific choice.
Use the same cut-off time each week. If one week includes late Sunday sales and the next excludes them, comparisons become unreliable. Record delayed data separately rather than quietly changing the period.
Weekly reporting is especially valuable because it is frequent enough to reveal emerging issues, while still allowing time for meaningful work to occur between reviews.
🧩 Keep the First Version Deliberately Small
A first scorecard can work with eight to twelve measures. Trying to build a complete management information system immediately often leads to abandoned spreadsheets and inconsistent data entry.
Start with the four areas in the title: revenue, expenses, leads, and productivity. Add a metric only when it answers a recurring management question that the existing measures cannot answer.
- Can we see whether the business earned or secured more work?
- Can we see whether spending is under control?
- Can we see whether future demand is being built?
- Can we see whether the team can deliver its commitments?
If the scorecard answers those questions clearly, it is already doing important work.
💵 Separate Cash Received From Revenue Earned
“Revenue” can mean different things. A business may earn revenue when it delivers a product or service, invoice a customer at another point, and receive cash later. These can all be legitimate measures, but they should never be treated as interchangeable.
For a simple weekly scorecard, label the number precisely: sales booked, revenue recognized, invoices issued, or cash collected. A project business might track booked contract value and cash received side by side.
This distinction matters because a strong sales week does not automatically solve a near-term cash problem, and a large payment received may relate to work completed much earlier.
📈 Track Revenue With a Useful Comparison
A weekly revenue number has limited meaning without context. Compare it with a target, the prior week, the same period last year where seasonality is relevant, or a rolling average. Select comparisons that fit your operating model rather than adding every possible benchmark.
A rolling average smooths normal fluctuations. For instance, a four-week rolling average shows the average result across the latest four completed weeks. It is helpful when one large deal or delayed invoice would otherwise create a misleading spike.
Use a short note for material changes. “Revenue fell because a planned client launch moved to next week” is more informative than a red cell alone.
🧮 Include Gross Margin When Direct Costs Matter
Revenue growth can hide an unhealthy business if direct costs rise just as quickly. Gross margin is the amount left after direct costs required to deliver sales are deducted. In a shop, direct costs may include inventory; in a service business, they may include subcontractor time or delivery-specific materials.
The exact treatment of costs should match your accounting approach. The scorecard does not need to settle every accounting judgment, but it should use a consistent method.
Track gross margin in currency and, where helpful, as a percentage of revenue. A changing percentage can signal discounting, higher supplier costs, unprofitable work, or a shift in the mix of products sold.
💳 Classify Expenses Before Judging Them
Weekly expenses should not become a vague list of payments. Separate recurring operating costs, direct delivery costs, discretionary spending, and unusual or one-off items. This makes the discussion more accurate.
A software subscription, travel for a sales visit, and a replacement laptop may all reduce cash this week, but they raise different questions. One may be a fixed commitment, one an investment in customer acquisition, and one an exceptional purchase.
Where accounting records lag behind bank transactions, use a clearly labelled preliminary cash-out figure. Update the formal financial records through the normal process rather than treating a weekly dashboard as the ledger.
🏦 Watch the Cash Timing Risk
Profit and cash are related but different. A profitable business can still face pressure if customers pay slowly while wages, suppliers, rent, or tax obligations fall due sooner.
A basic scorecard can show closing cash balance, cash received, cash paid, and overdue customer invoices. It may also include a short forward-looking note about known large payments or receipts expected soon.
Do not treat a weekly cash view as a complete cash forecast. It is an early-warning tool. Larger obligations, credit arrangements, tax payments, and uncertainty in customer payment dates need appropriate financial oversight.
🧲 Define What Counts as a Lead
Lead metrics become meaningless when every contact is counted the same way. A downloaded guide, an unsolicited inquiry, a referral introduction, and a buyer who has requested a proposal may all be valuable, but they represent different levels of intent.
Create a plain-language definition. For example, a “qualified lead” could be a contact with a relevant need, a plausible budget or buying capacity, and a next conversation agreed. The right definition depends on the business.
Document the rule beside the scorecard. This avoids one person counting social media interest while another counts only scheduled discovery calls.
🔎 Track the Lead Funnel, Not Just the Top
A lead total answers “how much interest arrived?” It does not answer whether the sales process is working. A compact funnel adds stages that reveal where prospects are progressing or stopping.
| Stage | What it indicates | Useful weekly question |
|---|---|---|
| New inquiries | Initial demand | Which sources generated relevant interest? |
| Qualified leads | Potential fit and intent | Are we attracting the right prospects? |
| Proposals or quotes | Active sales opportunities | Are opportunities moving forward promptly? |
| Wins | New business secured | What helped customers choose us? |
Not every business needs every stage. A high-volume online seller may track visits, carts, and completed orders instead. Keep the stages close to the actual customer journey.
⏱️ Measure Follow-Up Speed Carefully
For many sales processes, speed of response affects whether a genuine inquiry becomes a conversation. A weekly scorecard can track the percentage of new leads contacted within your chosen service standard, or the average time to first meaningful response.
“Meaningful” matters. An automated acknowledgement may be useful, but it is not the same as answering a question, booking a call, or providing a relevant next step.
Use this measure to improve process design, not to reward rushed and low-quality replies. A fast response that ignores the customer’s need creates activity without trust.
🔗 Attribute Lead Sources With Humility
Knowing where leads come from helps allocate marketing effort. Common source categories include referrals, search, events, partners, social channels, paid campaigns, repeat customers, and outbound outreach.
Attribution is rarely perfect. A customer may first notice a business in one place, research it elsewhere, and inquire after a recommendation. Allow an “unknown” category rather than forcing a false answer.
Review source quality over several weeks or months. A channel that produces fewer inquiries may still be more valuable if those inquiries are more likely to become suitable customers.
🛠️ Define Productivity as Output, Not Busyness
Productivity is often misunderstood as visible effort: hours online, messages sent, or meetings attended. These may be necessary activities, but they are not automatically productive.
A better definition is useful output produced from available time and resources while maintaining acceptable quality. The output should connect to the team’s work: completed client deliverables, orders fulfilled, cases resolved, features released, or qualified customer conversations held.
This protects the scorecard from becoming a surveillance tool. The aim is to improve the system of work, not to count keystrokes or reward performative busyness.
📦 Choose Output Measures That Fit the Work
Different functions need different productivity measures. A warehouse may monitor accurate orders dispatched. A customer-support team may consider resolved cases and customer-impact indicators. A design team may track approved deliverables or progress through defined project milestones.
Use volume with a quality check where possible. Counting completed cases alone can encourage premature closure; pairing it with reopen rates, error rates, or review outcomes creates a more balanced picture.
- Service team: deliverables completed, on-time rate, rework required
- Sales team: qualified conversations, proposals submitted, follow-ups completed
- Operations team: orders processed, accuracy, backlog age
- Knowledge team: milestone progress, cycle time, stakeholder acceptance
🕰️ Distinguish Capacity From Productivity
Capacity is the amount of work a team could reasonably handle. Productivity is how effectively that capacity becomes useful output. They influence each other, but they are not the same.
If a team has fewer working hours because of holidays, training, illness, or a vacancy, lower output may be expected. Comparing raw totals without this context can create unfair conclusions.
For some teams, it is helpful to record available capacity, such as staffed hours or people scheduled, alongside output. Avoid pretending that every hour has identical value; complex work also needs planning, learning, and recovery time.
🚦 Add Quality and Service Guardrails
A single productivity target can create harmful shortcuts. If a call centre measures only calls handled, employees may rush customers. If a development team measures only items completed, it may split work into smaller pieces without creating more value.
Use one or two guardrails that reveal whether output remains useful. These might include error rates, customer complaints, returns, missed deadlines, rework, or a simple quality-review result.
What gets measured can influence behaviour. Discuss likely unintended incentives before publishing a metric, especially when it affects performance evaluation or compensation.
🧾 Create a Metric Dictionary
A metric dictionary is a short reference that states exactly how each measure is calculated. It turns a scorecard from a personal worksheet into a repeatable management tool.
For every metric, record its name, definition, data source, calculation, reporting period, owner, and known limitations. This can be a separate sheet or a compact page beside the dashboard.
For example, “qualified leads” should specify whether it counts newly qualified leads during the week, all open qualified leads, or both. Small wording differences can completely change the number.
🗂️ Build a Simple Scorecard Layout
The main view should fit on one screen or printed page. Group measures under the four core areas, then show current value, comparison value, status, owner, and a brief comment.
A practical structure might use columns for metric, current week, target or baseline, change, status, owner, and action. Keep detailed transaction lists in source systems or supporting tabs, not on the executive view.
Use colours sparingly. Green, amber, and red are quick visual signals, but a status should be based on an agreed rule rather than a reviewer’s mood.
🧑💼 Assign an Owner to Every Number
The person who owns a metric is not necessarily responsible for making it improve alone. They are responsible for ensuring the definition is understood, the data is gathered reliably, and unusual movement is explained or investigated.
Revenue may be owned by a sales lead, cash by a finance owner, lead follow-up by a commercial operations manager, and delivery measures by an operations lead. In a very small business, one person may hold several roles.
Clear ownership reduces the weekly meeting ritual of asking who has the latest figure. It also makes data-quality problems visible quickly.
🔄 Automate Only After the Logic Works
Spreadsheets are often the right place to start. They are flexible, inexpensive, and transparent. Manually entering a small number of figures can also help a manager understand where each number comes from.
Automation becomes valuable when manual collection is repetitive, error-prone, or too slow. Connect accounting, customer relationship management, project, and task systems only after metric definitions are stable.
Automated dashboards can reproduce bad logic very efficiently. Test totals against source records, document refresh timing, and make it clear when data is preliminary or delayed.
📊 Use Targets, Baselines, and Thresholds Differently
A target is a desired result, such as a planned number of qualified opportunities. A baseline is a normal recent level used for comparison. A threshold is a point that triggers attention or action.
These serve different purposes. A new business may lack enough history for reliable baselines, while an established seasonal business may find last week’s result a poor comparison. Thresholds should reflect operational consequences: for example, a lead backlog that risks slow response.
Review these reference points periodically. A target that never changes can become irrelevant; a threshold that generates constant alerts eventually gets ignored.
🧠 Read Trends Before Explaining Individuals
Weekly numbers are noisy. A single late invoice, public holiday, major customer order, or staff absence can change a result without revealing a deeper problem. Look for patterns across several weeks before making broad conclusions.
When a number moves, ask: is this a data issue, a timing issue, a one-off event, or a trend? Then ask what evidence would distinguish those possibilities.
This approach prevents scorecard meetings from becoming blame sessions. The first task is understanding the system; accountability follows through clear actions and follow-up.
🗣️ Run a Short, Disciplined Weekly Review
A scorecard meeting can take 20 to 40 minutes for a small team if participants review the figures beforehand. Start with safety-critical, cash-critical, or customer-critical exceptions, then move through the remaining areas.
- Confirm whether the data is complete enough to use.
- Identify the few material movements or exceptions.
- Discuss causes, separating evidence from assumptions.
- Choose actions, owners, and due dates.
- Review actions agreed in the previous meeting.
Do not use this meeting for every detailed problem-solving conversation. Park complex issues for a smaller follow-up session with the people closest to the work.
✅ Turn Observations Into Testable Actions
“Improve lead follow-up” is an intention, not an action. A better action might be: “For the next two weeks, route website inquiries to a rotating daily owner and contact each qualified inquiry by the next business day.”
Good actions state what will change, who will do it, and when the result will be reviewed. They may also state the expected mechanism: faster initial contact should reduce the number of leads waiting without a next step.
Not every action will work. That is useful information if the team records the outcome and adjusts rather than quietly moving on.
⚠️ Avoid Vanity Metrics and False Precision
Vanity metrics look impressive but do not reliably connect to a decision or business result. A large social audience, total website visits, or number of tasks created may be worth monitoring in context, but they should not displace measures of qualified demand, conversion, cash, quality, or delivery.
False precision is another risk. Reporting a highly exact percentage can imply confidence that the underlying data does not deserve. Round where appropriate and use comments to explain uncertainty.
A scorecard should make ambiguity visible. Hiding incomplete data behind a polished chart creates a more dangerous illusion than admitting “not yet confirmed.”
🧱 Expect Data Problems and Design Around Them
Duplicate customer records, inconsistent categories, late time entries, and unclear project statuses are normal operational problems. Do not wait for perfect data before starting; instead, identify the most important weaknesses and improve them gradually.
Add a data-confidence note when needed. If expense coding is incomplete, state that the weekly expense figure is provisional. If a productivity measure excludes outsourced work, say so.
Over time, repeated scorecard questions often reveal the data processes worth fixing first. The dashboard becomes a practical reason to improve operational discipline.
🌱 Adapt the Scorecard as the Business Changes
A scorecard should be stable enough to reveal trends, but not frozen forever. New products, a change in pricing model, a growing team, or a new sales channel can make old measures less useful.
Review the scorecard design every quarter or whenever strategy changes materially. Remove metrics that no longer lead to discussion or action, and add measures only after defining the decision they will support.
Preserve historical definitions where possible. If a calculation changes, mark the change clearly so readers do not compare unlike numbers across periods.
🧪 A Simple Example for a Service Business
Consider a hypothetical small marketing agency. Its weekly scorecard might show contracts signed, invoices issued, cash received, direct freelancer costs, new inquiries, qualified discovery calls, proposals sent, on-time client deliverables, and rework hours.
Suppose inquiries rise while qualified calls remain flat. The team should not assume marketing is succeeding or failing solely from the inquiry number. It could examine source quality, the enquiry form, response time, and the criteria used to qualify prospects.
Suppose delivery output falls while rework rises. The useful question is not “who worked less?” It is whether unclear briefs, rushed handovers, workload imbalance, or a quality issue is consuming capacity.
🏁 Build a Management Habit, Not a Reporting Ritual
The best scorecard is not the one with the most formulas or the prettiest charts. It is the one reviewed consistently by people willing to investigate results, make focused decisions, and learn from what happens next.
Keep the information simple enough to trust and specific enough to act on. Revenue shows current commercial performance; expenses and cash show financial discipline; leads reveal the future pipeline; productivity and quality show whether the organization can deliver.
A weekly scorecard works when it turns scattered business data into a small number of timely conversations and accountable actions.
Begin with a modest first version, use it for several weeks, and refine it based on the questions your business genuinely needs to answer. The habit of noticing, deciding, and following through is more valuable than a complicated dashboard nobody opens. 📊✅🚀