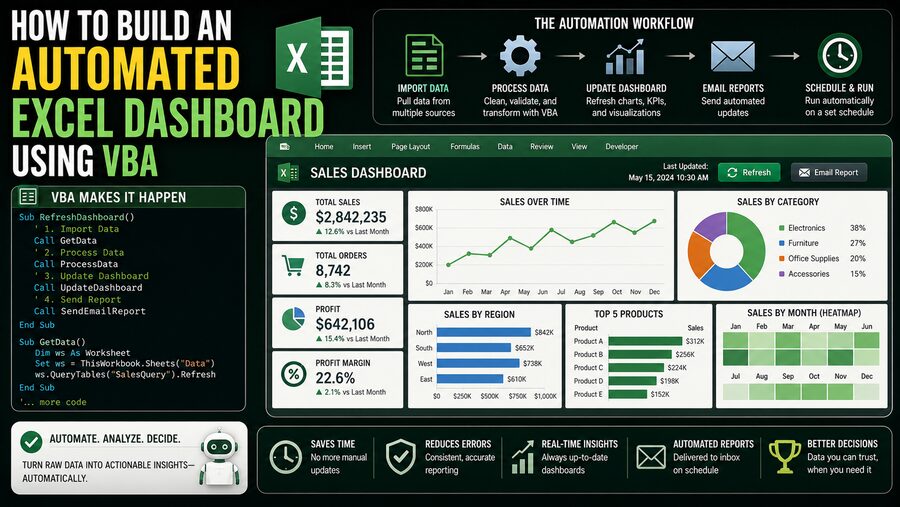

Excel dashboards are widely used for tracking sales, finances, operations, inventory, projects, customer activity, and other business metrics. A well-designed dashboard can transform thousands of spreadsheet rows into a compact collection of KPIs, charts, summaries, and trends that decision-makers can understand quickly. 📈💼
The challenge is that dashboards often require repetitive work.
Someone may need to:
- Import new data
- Clean inconsistent records
- Refresh PivotTables
- Update formulas
- Change reporting dates
- Recalculate KPIs
- Refresh charts
- Export the dashboard
- Save the finished report
Performing those tasks manually every day or week can become tedious and error-prone.
This is where VBA—Visual Basic for Applications— can help.
VBA is the programming language built into desktop Microsoft Office applications such as Excel. It allows users to write macros that control workbook objects, manipulate data, refresh reports, format worksheets, and automate repetitive actions. ⚙️
An automated Excel dashboard can therefore follow a workflow such as:
Raw data ➡️ VBA automation ➡️ cleaned data ➡️ PivotTables/calculations ➡️ charts ➡️ finished dashboard
Instead of rebuilding the report manually, the user can click a button such as Refresh Dashboard, and Excel performs the routine steps automatically.
🧠 What Makes an Excel Dashboard “Automated”?
A normal dashboard may already contain charts and formulas, but someone still has to update the underlying data.
An automated dashboard reduces that manual effort.
For example, pressing one button might instruct Excel to:
- Clear last month’s imported records.
- Import the newest dataset.
- Remove blank or invalid rows.
- Update formulas.
- Refresh PivotTables.
- Recalculate KPIs.
- Refresh charts.
- Add the current refresh timestamp.
- Save the workbook.
The goal is not necessarily to automate every possible decision.
Instead, VBA handles predictable and repetitive work so the user can focus on interpreting the results. 🎯
🏗️ Step 1: Plan the Workbook Structure
Before writing VBA, organize the workbook carefully.
A clean dashboard workbook might contain worksheets such as:
Dashboard
Displays KPIs, charts, filters, and summary information.
Raw_Data
Contains imported transactional data.
Calculations
Contains formulas, intermediate calculations, or summary tables.
Pivot_Data
Contains PivotTables or supporting analysis.
Config
Stores parameters such as reporting periods, file paths, and targets.
Keeping raw data separate from presentation makes the workbook much easier to automate.
A simple architecture could be:
External data file
⬇️
Raw_Data sheet
⬇️
PivotTables / formulas
⬇️
Dashboard
This separation also reduces the chance that VBA accidentally overwrites dashboard elements while processing data.
🧾 Step 2: Convert Source Data Into an Excel Table
Excel Tables are extremely useful for automated dashboards.
Suppose your raw dataset contains:
- Date
- Region
- Salesperson
- Product
- Units
- Revenue
- Cost
Convert the range into an Excel Table using:
Insert ➡️ Table
Give it a meaningful name such as:
tblSales
Tables automatically expand when new rows are added.
This is much better than building formulas and PivotTables around fixed ranges such as:
A1:G5000
because next month’s data may extend beyond row 5,000.
Dynamic tables make your dashboard more resilient.
🛠️ Step 3: Enable VBA and Open the Visual Basic Editor
To work with VBA, enable the Developer tab in desktop Excel if it is not already visible.
Then open the VBA editor using:
Developer ➡️ Visual Basic
or the keyboard shortcut:
Alt + F11
Inside the editor, insert a standard module:
Insert ➡️ Module
You can now create VBA procedures.
A simple macro looks like this:
Sub RefreshDashboard()

    MsgBox "Dashboard refresh started."

End Sub
Running the macro displays a message box.
Although simple, it demonstrates the basic structure:
Sub MacroName()

    ' Instructions go here

End Sub
📥 Step 4: Automate Data Import
Suppose the newest data is stored in another Excel workbook.
VBA can open that workbook, copy the source records, and paste them into your dashboard workbook.
A simplified example is:
Sub ImportSalesData()

    Dim wbSource As Workbook
    Dim wsSource As Worksheet
    Dim wsTarget As Worksheet
    Dim filePath As String
    Dim lastRow As Long

    filePath = "C:\Reports\SalesData.xlsx"

    Set wsTarget = ThisWorkbook.Worksheets("Raw_Data")

    wsTarget.Cells.ClearContents

    Set wbSource = Workbooks.Open(filePath)
    Set wsSource = wbSource.Worksheets("Sales")

    lastRow = wsSource.Cells(wsSource.Rows.Count, "A").End(xlUp).Row

    wsSource.Range("A1:G" & lastRow).Copy _
        Destination:=wsTarget.Range("A1")

    wbSource.Close SaveChanges:=False

End Sub
This macro:
📂 Opens the source workbook
🧹 Clears old data
📋 Copies the latest records
📥 Pastes them into the dashboard workbook
🚪 Closes the source workbook
In production workbooks, you would usually add validation and error handling so a missing or malformed source file does not leave the dashboard in an inconsistent state.
📁 Let the User Select the Data File
Hard-coding a file path is not always convenient.
A more flexible dashboard can show a file-selection dialog:
Sub SelectAndImportFile()

    Dim filePath As Variant

    filePath = Application.GetOpenFilename( _
        "Excel Files (*.xlsx), *.xlsx")

    If filePath = False Then Exit Sub

    MsgBox "Selected file: " & filePath

End Sub
Now the user can choose the appropriate input file instead of editing VBA code every month.
🧹 Step 5: Clean the Imported Data
Incoming business data is rarely perfect.
It may contain:
- Blank rows
- Duplicate records
- Incorrect dates
- Missing values
- Leading spaces
- Invalid categories
VBA can automate some of this cleanup.
For example, to remove completely blank rows from a simple dataset:
Sub RemoveBlankRows()

    Dim ws As Worksheet
    Dim lastRow As Long
    Dim i As Long

    Set ws = ThisWorkbook.Worksheets("Raw_Data")

    lastRow = ws.Cells(ws.Rows.Count, "A").End(xlUp).Row

    For i = lastRow To 2 Step -1

        If Application.WorksheetFunction.CountA(ws.Rows(i)) = 0 Then
            ws.Rows(i).Delete
        End If

    Next i

End Sub
Notice that the loop moves from bottom to top.
This prevents row deletion from causing records to be skipped.
🔄 Step 6: Refresh PivotTables Automatically
PivotTables are excellent dashboard tools because they can summarize large datasets quickly.
Once your source data changes, VBA can refresh all PivotTables.
One convenient command is:
ThisWorkbook.RefreshAllA more targeted PivotTable refresh might look like:
Sub RefreshAllPivotTables()

    Dim ws As Worksheet
    Dim pt As PivotTable

    For Each ws In ThisWorkbook.Worksheets

        For Each pt In ws.PivotTables
            pt.RefreshTable
        Next pt

    Next ws

End Sub
This loops through every worksheet and refreshes every PivotTable.
If your dashboard uses PivotCharts connected to those PivotTables, the associated charts generally update as the PivotTables refresh. 📊
🔢 Step 7: Build KPI Calculations
Most dashboards contain important Key Performance Indicators, or KPIs.
Examples include:
💰 Total Revenue
📦 Units Sold
📈 Growth Rate
🎯 Target Achievement
👥 Active Customers
💵 Gross Profit
📉 Return Rate
Suppose you want total revenue from a sales table.
The worksheet could use formulas such as:
=SUM(tblSales[Revenue])Or the KPI could be driven by a PivotTable.
It is usually better to let Excel formulas, Tables, or PivotTables perform routine calculations while VBA orchestrates the refresh.
In other words:
Excel calculates. VBA coordinates.
That separation often makes the workbook easier to audit and maintain.
📈 Step 8: Create Dynamic Charts
Your dashboard might contain charts for:
- Monthly sales
- Revenue by region
- Product performance
- Expenses versus budget
- Year-over-year growth
Charts linked to Excel Tables or PivotTables can update automatically when their source data changes.
VBA can also modify chart properties.
For example:
Sub UpdateChartTitle()

    Dim ws As Worksheet

    Set ws = ThisWorkbook.Worksheets("Dashboard")

    ws.ChartObjects("chtSales").Chart.ChartTitle.Text = _
        "Sales Performance - " & Format(Date, "mmmm yyyy")

End Sub
The chart title now changes according to the current month. 📅
🎛️ Step 9: Add Interactive Filters
Dashboards are more useful when users can explore the data.
Excel provides tools such as:
Slicers
Timeline controls
Drop-down lists
PivotTable filters
A sales dashboard might let users filter by:
🌍 Region
📦 Product
👤 Salesperson
📅 Month
🏢 Business unit
Slicers are particularly useful because they create clickable dashboard controls without requiring the user to interact directly with the underlying PivotTable.
VBA can also change filters programmatically when needed.
🔘 Step 10: Add a “Refresh Dashboard” Button
Instead of making users open the VBA editor, add a visible button.
On the Dashboard worksheet:
Developer ➡️ Insert ➡️ Button
Assign the button to your main macro.
For example:
Sub RefreshDashboard()

    Application.ScreenUpdating = False
    Application.EnableEvents = False

    ImportSalesData

    ThisWorkbook.RefreshAll

    Application.CalculateFull

    UpdateChartTitle

    Worksheets("Dashboard").Range("B2").Value = _
        "Last refreshed: " & Format(Now, "dd-mmm-yyyy hh:mm")

    Application.EnableEvents = True
    Application.ScreenUpdating = True

    MsgBox "Dashboard updated successfully."

End Sub
Now the entire workflow can be launched from one button. 🚀
⚡ Why Disable Screen Updating?
When VBA modifies many cells, Excel may redraw the screen after nearly every action.
That can make a macro appear slow or cause distracting flickering.
This command temporarily disables screen refresh:
Application.ScreenUpdating = FalseAfter the automation finishes:
Application.ScreenUpdating = TrueFor large workbooks, this can noticeably improve perceived performance.
🚨 Step 11: Add Error Handling
Automation needs to deal gracefully with unexpected situations.
What happens if:
- The source file is missing?
- A worksheet was renamed?
- The imported file has no data?
- A PivotTable fails to refresh?
Without error handling, the macro might stop abruptly.
A simple pattern is:
Sub SafeRefresh()

    On Error GoTo ErrorHandler

    Application.ScreenUpdating = False
    Application.EnableEvents = False

    ThisWorkbook.RefreshAll
    Application.CalculateFull

CleanExit:

    Application.EnableEvents = True
    Application.ScreenUpdating = True

    Exit Sub

ErrorHandler:

    MsgBox "Dashboard refresh failed: " & Err.Description
    Resume CleanExit

End Sub
The important detail here is that Excel settings are restored even if an error occurs.
Otherwise, a failed macro could accidentally leave events or screen updating disabled.
✅ Step 12: Validate the Imported Data
Good automation should not blindly trust incoming files.
Before updating the dashboard, VBA can check whether required columns exist.
Suppose the dashboard requires:
Date, Region, Product, Revenue
If the uploaded file is missing the Revenue column, continuing the refresh could produce misleading charts.
A validation routine can stop the process and tell the user what is wrong.
This is an important principle:
Automating bad data faster does not create a better dashboard. ⚠️
Data validation should therefore be part of the automation workflow.
🕒 Step 13: Add a Refresh Timestamp
Users should know whether they are viewing current information.
One simple solution is to place a timestamp on the dashboard:
Worksheets("Dashboard").Range("B2").Value = _
    "Updated: " & Format(Now, "dd-mmm-yyyy hh:mm")
Your dashboard might display:
Updated: 20-Aug-2026 16:25
This small feature increases confidence in the report because users can immediately see how fresh the data is.
🗂️ Step 14: Automatically Save the Updated Workbook
At the end of the process, VBA can save the workbook:
ThisWorkbook.SaveYou can also create a separate dated copy:
ThisWorkbook.SaveCopyAs _
    "C:\Reports\Dashboard_" & Format(Date, "yyyymmdd") & ".xlsm"
This could produce:
Dashboard_20260820.xlsm
Keeping historical report versions may be useful for auditing and monthly reporting.
📄 Step 15: Export the Dashboard to PDF
Sometimes managers need a static dashboard that can be emailed or archived.
VBA can export a worksheet as a PDF.
For example:
Sub ExportDashboardPDF()

    Dim filePath As String

    filePath = ThisWorkbook.Path & _
               "\Dashboard_" & _
               Format(Date, "yyyymmdd") & ".pdf"

    Worksheets("Dashboard").ExportAsFixedFormat _
        Type:=xlTypePDF, _
        Filename:=filePath

End Sub
The workflow can therefore become:
Import ➡️ clean ➡️ refresh ➡️ calculate ➡️ update charts ➡️ export PDF
That can save substantial time for recurring management reports. 📄⚙️
🧩 Build One Master Automation Procedure
As the workbook grows, avoid putting hundreds of unrelated instructions into one giant macro.
Instead, create smaller procedures:
Sub MainDashboardRefresh()

    ImportSalesData
    CleanImportedData
    RefreshAllPivotTables
    UpdateKPIs
    UpdateCharts
    AddRefreshTimestamp
    ExportDashboardPDF

End Sub
Each procedure has one clear responsibility.
This makes debugging much easier.
If chart updates fail, you can investigate UpdateCharts rather than searching through a massive block of code.
🏎️ Performance Tips for Large Dashboards
A large Excel dashboard can become slow if VBA processes thousands of cells individually.
For better performance:
- Avoid repeatedly selecting cells.
- Work directly with Range objects.
- Use Excel Tables.
- Read large ranges into arrays when appropriate.
- Minimize worksheet writes.
- Avoid unnecessary
SelectandActivate. - Temporarily disable screen updating.
- Use targeted calculations where practical.
For example, avoid:
Range("A1").Select
Selection.Value = 100
Prefer:
Range("A1").Value = 100The second version is shorter, faster, and easier to maintain. ⚡
🔐 Macro Security Matters
VBA macros can modify files and automate powerful actions, so Excel treats macro-enabled workbooks differently from ordinary spreadsheets.
A workbook containing VBA normally uses the:
.xlsm
file format.
Users should enable macros only from trusted sources.
Organizations may also use:
- Trusted locations
- Digital signatures
- Macro policies
- Protected environments
If a workbook is distributed widely, explain clearly what the macros do and avoid unnecessary permissions or external dependencies.
Security should be part of dashboard design rather than an afterthought. 🔒
☁️ Know Where VBA Fits—and Where It Does Not
VBA is especially useful for automating desktop Excel workflows.
However, organizations increasingly use cloud-based data and automation tools.
Depending on the project, technologies such as:
- Power Query
- Power Pivot
- Office Scripts
- Power Automate
- Power BI
may complement or replace portions of a VBA solution.
For example, Power Query is often excellent for importing and transforming structured data, while VBA can orchestrate the workbook experience and handle desktop-specific actions.
A strong solution may combine multiple tools rather than forcing VBA to perform everything.
🎨 Dashboard Design Still Matters
Automation does not automatically create a good dashboard.
The visual interface should remain simple.
A useful layout might include:
Top Row
Four major KPI cards:
Revenue | Profit | Orders | Growth
Middle Section
Charts for:
📈 Monthly trend
🌍 Regional performance
📦 Product mix
Side Panel
Filters for:
📅 Date
🏢 Region
📦 Product
Footer
Last refreshed timestamp
Avoid filling the screen with dozens of charts.
A dashboard should help users answer important questions quickly.
🧭 Example End-to-End Automated Dashboard
Imagine a company receives a monthly sales workbook.
The final automation could work like this:
1. User clicks “Refresh Dashboard.” 🔘
2. VBA opens the latest sales file.
3. Records are copied into Raw_Data.
4. VBA validates required columns.
5. Invalid or blank records are cleaned.
6. Excel Tables resize automatically.
7. PivotTables refresh.
8. KPI formulas recalculate.
9. Charts update.
10. Dashboard filters remain available to users.
11. A refresh timestamp is added.
12. A PDF copy is exported.
13. The workbook is saved.
A reporting process that previously required many manual operations is reduced to a repeatable button-driven workflow. ⚙️📊
⚠️ Common VBA Dashboard Mistakes
Several problems appear frequently in automated workbooks.
❌ Hard-Coded Ranges
Using:
A1:G1000
may fail when the dataset grows.
Prefer dynamic Tables or calculated last rows.
❌ Excessive Use of Select
Recorded macros often contain unnecessary selections.
Work with objects directly.
❌ No Validation
Never assume every input file has the expected structure.
❌ No Error Handling
A macro should fail safely and explain the problem.
❌ Mixing Raw Data and Dashboard Elements
Keep data-processing worksheets separate from presentation sheets.
❌ Automating an Unstable Manual Process
Before automating, make sure the business logic itself is reasonably consistent.
Automation should encode a reliable process—not hide confusion inside VBA.
🏁 Conclusion
An automated Excel dashboard combines the familiar reporting power of Excel with the repetitive-task automation capabilities of VBA. 📊⚙️
The dashboard itself presents information through:
KPIs + charts + PivotTables + filters
while VBA handles tasks such as:
Importing + cleaning + refreshing + recalculating + exporting + saving
The most effective architecture is usually modular:
Source data ➡️ Raw_Data ➡️ calculations/PivotTables ➡️ dashboard ➡️ automated output
Rather than building one enormous macro, create small procedures for specific tasks and connect them through a master refresh routine.
Add validation so bad data is caught early.
Use error handling so the workbook can recover safely.
Use dynamic tables instead of fragile fixed ranges.
And most importantly, automate the parts of reporting that are genuinely repetitive.
When designed carefully, an Excel dashboard that once required repeated copying, filtering, recalculation, formatting, and exporting can become a reliable workflow launched with a single click. 🚀
That is the real value of VBA dashboard automation: not merely making Excel more complicated, but making recurring reporting simpler, faster, and more consistent. 💼📈