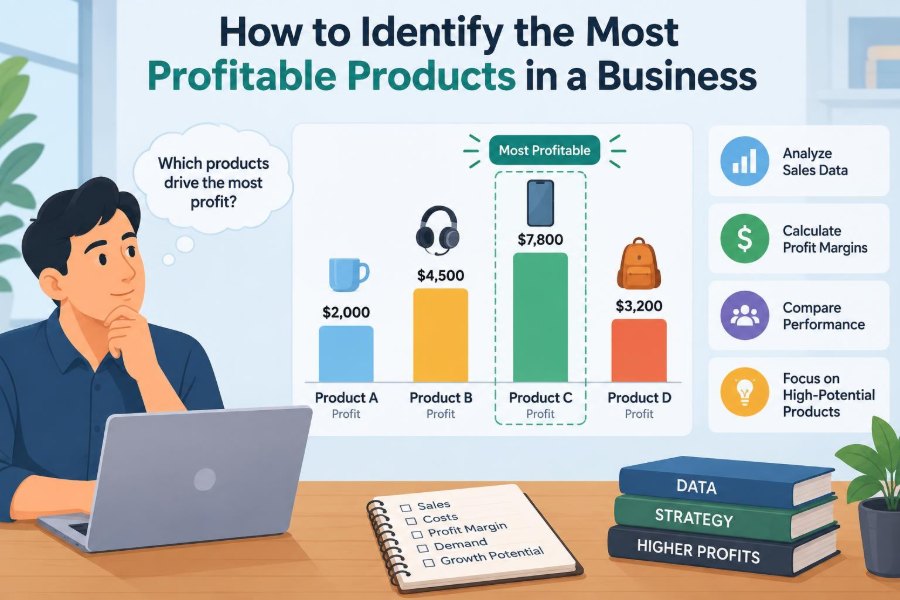

A product can be one of a company’s best sellers and still be a poor source of profit. A busy café may sell hundreds of muffins each morning, for example, while a less popular catered lunch package contributes far more money after ingredients, labour, delivery, and waste are considered.
This distinction matters because sales figures are highly visible. They appear on dashboards, receipts, and team targets. The costs that sit behind each sale are often scattered across purchasing records, payroll, shipping invoices, returns, and marketing reports.
When managers focus only on revenue, they can accidentally promote products that create activity without creating much financial return. They may also underinvest in quieter products that are doing most of the work of funding the business.
Identifying the most profitable products is therefore not about finding a single “winner” in a spreadsheet. It is a structured process of measuring what each product earns, what it consumes, and what it allows the business to do next.
🔎 Start with the right meaning of “profitable”
A profitable product brings in more value than it costs the business to sell and support. The complication is that there are several valid ways to measure that value, each answering a different management question.
Product profitability usually means the profit attributable to a product over a chosen period. It should not be confused with popularity, market share, revenue, or cash received. A product can score well on one of these measures and poorly on another.
Before analysing results, decide whether you want to identify products that generate the most total profit, the highest profit per unit, the best cash contribution, or the best long-term customer value.
💰 Separate revenue from profit
Revenue is the money earned from sales before most costs are deducted. Profit is what remains after relevant costs are removed. This sounds basic, but confusing the two is one of the most common product decisions mistakes.
Imagine Product A produces $100,000 in sales with $85,000 in related costs. Product B produces $60,000 in sales with $30,000 in related costs. Product A wins on revenue, but Product B produces twice as much profit.
Revenue is still useful. It shows customer demand and commercial scale. It simply cannot tell management, on its own, which products deserve additional stock, promotion, development, or shelf space.
📈 Calculate gross profit first
Gross profit is sales revenue minus the direct cost of making or buying what was sold. For a retailer, this commonly includes the supplier purchase cost. For a manufacturer, it may include materials and directly traceable production labour.
The formula is straightforward:
Gross profit = Sales revenue − Cost of goods sold
Gross profit is a sensible first screen because it reveals whether a product leaves enough money after its most direct cost. But it does not include every cost caused by selling the product, such as delivery, sales commissions, payment fees, or returns.
📊 Use gross margin to compare unlike products
Gross margin expresses gross profit as a percentage of sales revenue. This makes it easier to compare products with different prices and sales volumes.
Gross margin = Gross profit ÷ Sales revenue × 100
A $10 item that creates $4 of gross profit has a 40% gross margin. A $100 item that creates $20 of gross profit has a 20% gross margin. The higher-margin item earns more from each sales dollar, but that alone does not make it the better product.
Margin and total profit answer different questions. A low-margin product sold in large volume may contribute more total money than a high-margin niche product.
🧮 Move from gross profit to contribution margin
For many operational decisions, contribution margin is more informative than gross profit. It deducts all variable costs: costs that rise or fall as more units are sold.
Depending on the business, variable costs can include packaging, card-processing fees, sales commissions, marketplace fees, pick-and-pack labour, shipping subsidies, and expected returns. The remaining amount contributes toward fixed costs and, eventually, operating profit.
Contribution margin per unit = Selling price − Variable cost per unit
This is especially valuable when choosing what to promote. A product with a strong gross margin may have a weak contribution margin if it is costly to ship, frequently returned, or heavily commission-based.
🏢 Treat fixed costs thoughtfully
Fixed costs do not usually change immediately with each extra unit sold. Rent, core software subscriptions, salaried management, and general administration are common examples. These costs must be covered, but allocating them to products requires judgment.
If every product is assigned an equal slice of head-office rent, the result may be convenient but misleading. Products do not necessarily use equal amounts of space, management attention, or support resources.
Use fixed-cost allocations to understand longer-term product economics, but avoid letting arbitrary allocations obscure short-term decisions. When spare capacity exists, a product that makes a positive contribution may still be worth selling even if its fully allocated profit appears small.
🧾 Build a unit economics view
Unit economics asks what happens financially when the business sells one more unit. It turns broad accounting data into a practical management tool.
A simple unit view might include the selling price, product cost, handling cost, transaction fee, delivery cost, expected return cost, and contribution per unit. For a subscription or service, replace “unit” with one customer, contract, booking, or usage period.
When the unit calculation is reliable, managers can test questions quickly: Can the product support a discount? Does free shipping still make sense? How much commission can a sales partner receive? Is a price increase necessary?
🗂️ Gather data from the full sales-to-service journey
Profitability analysis fails when it relies on only one system. Sales records may show quantities and prices, while purchasing shows material costs, fulfilment systems show shipping, and customer-service tools show returns or support demand.
Create one product-level dataset with a consistent product code or stock-keeping unit (SKU). At a minimum, collect:
- units sold, selling price, refunds, and discounts;
- direct product or supplier cost;
- fulfilment, payment, and channel fees;
- returns, warranty, and customer-service costs where material;
- marketing or sales costs that can reasonably be linked to the product.
Data will rarely be perfect on the first attempt. A transparent estimate is usually more useful than a precise-looking figure built on incomplete costs.
🏷️ Create a consistent product and variant structure
A “product” may mean a whole product family, a model, a size, a colour, or a customer-specific configuration. If definitions shift between reports, comparisons become unreliable.
For example, a clothing retailer may find that a jacket style is profitable overall but certain sizes create most markdowns and returns. A software company may find that one plan appears profitable until unusually demanding customer configurations are separated.
Start at the level where decisions are actually made. If prices, costs, or demand vary meaningfully by variant, analyse variants separately and then roll them up to the broader product family.
🧷 Assign direct costs accurately
Direct costs are costs that can be traced to a product without much interpretation. They deserve careful attention because small errors can reverse the ranking of similar products.
For a manufacturer, bill-of-materials records should reflect current component prices, scrap, and packaging. For a retailer, the landed cost should include relevant freight, duties, and handling rather than only the supplier invoice price.
Check how costs change over time. Old inventory may have been bought at a different price from new inventory, so a single standard cost can conceal whether current sales remain worthwhile.
⚙️ Allocate indirect costs by the activity that causes them
Some costs support several products and cannot be directly traced. Rather than dividing them evenly, use a sensible cost driver: an activity that explains why the cost occurs.
Activity-based thinking can improve the analysis. Labour-intensive products might be assigned costs based on assembly minutes; bulky products by warehouse space or shipments; support-heavy products by service tickets or support time.
| Cost | Possible cost driver | Why it can help |
|---|---|---|
| Warehouse handling | Orders picked or cubic space | Reflects work or storage consumed |
| Production setup | Number of batches or changeovers | Recognises complexity costs |
| Customer support | Tickets or service hours | Shows support-intensive products |
| Advertising | Tracked campaign conversions | Connects spending to demand where possible |
No allocation method is flawless. The goal is to choose drivers that are understandable, reasonably stable, and better than a blanket split.
🏷️ Account for discounts and promotions
List price is not realised revenue. Promotional codes, negotiated deals, bundles, loyalty rewards, rebates, and price-matching can all reduce the amount actually retained from a sale.
Analyse profitability after discounts, preferably by customer segment or sales channel. A product might be attractive at full price but become unprofitable during routine promotions.
Discounts can still have a purpose, such as clearing aging stock or bringing in new customers. The point is to treat them as a deliberate investment with a measurable cost, not as a harmless way to increase sales volume.
↩️ Include returns, defects, and warranty exposure
Returns are often recorded separately from the original sale, making a product look better in early reports than it really is. The financial effect can include refunded revenue, return shipping, inspection, repackaging, disposal, and reduced resale value.
Use historical patterns to estimate an expected return or warranty cost per unit where individual attribution is impractical. Revisit the estimate if product quality, policies, or customer behaviour change.
A product with a modest return rate may still be profitable. The concern is a product whose sales growth also expands a hidden stream of expensive reverse logistics and support work.
🚚 Examine fulfilment and channel costs
The same product can have very different profitability depending on where and how it is sold. An online marketplace may charge referral and fulfilment fees; a wholesale buyer may demand a lower price; direct sales may require higher marketing or service spending.
Calculate product-channel profitability, not just product profitability. This reveals whether a product is funding one route to market while losing money through another.
Shipping is particularly easy to underestimate. Weight, dimensions, destination, split deliveries, special packaging, and delivery promises can all matter. Bulky low-priced products often deserve an especially careful review.
📣 Attribute marketing spend with care
Marketing can be linked directly to a product when a campaign promotes a specific item and sales can be reasonably tracked. In many cases, however, advertisements build awareness for a brand or influence several products at once.
Do not force false precision. Report a contribution view before broad marketing spend, then show the impact of directly attributable campaign costs separately. For larger strategic decisions, use a clear allocation rule and label it as an estimate.
A customer acquired for one product may later buy others. That does not make the initial product automatically profitable, but it does mean its role should be assessed within the wider customer relationship.
🔀 Compare products by both percentage and total contribution
Ranking products only by margin percentage tends to favour premium or inexpensive-to-serve items. Ranking only by total contribution tends to favour high-volume products. A sound portfolio review uses both.
A product with a 70% contribution margin that sells rarely may be a valuable specialist offering. A product with a 20% margin and substantial demand may be crucial for covering fixed costs. Neither result can be interpreted without the other.
Place products on a simple matrix of contribution per unit and total annual contribution. It quickly distinguishes high-volume earners, high-margin opportunities, low-return complexity, and products that need further investigation.
📦 Consider inventory investment and stock turns
Profit reported on paper is not the entire story. Inventory ties up cash and carries risks of damage, obsolescence, markdowns, and storage expense. A profitable product that sits in a warehouse for a long time can be less attractive than a slightly lower-margin product that sells quickly.
Stock turnover describes how frequently inventory is sold and replaced over a period. The appropriate rate varies widely by industry, seasonality, supply reliability, and product life cycle, so it should be compared with relevant peers rather than a universal target.
Consider return on inventory investment: how much contribution the product produces relative to the capital held in stock. This is often revealing for businesses with limited working capital.
💵 Follow the cash conversion cycle
A sale does not always produce cash immediately. A business may pay suppliers before selling stock, grant customers credit, or wait for a marketplace to release funds. Meanwhile, it must keep paying wages and operating bills.
A product can be accounting-profitable but strain cash flow if it requires large upfront purchases, slow customer payment, or expensive inventory holdings. Conversely, a product paid for in advance may help finance operations even with a more moderate margin.
Cash timing should not replace profitability measurement, but it should influence purchasing limits, payment terms, and product expansion plans.
👥 Segment profitability by customer type
Different customers can make the same product economically different. One segment may buy at full price in predictable quantities, while another expects customisation, frequent support, special delivery, and extended payment terms.
Segment analysis can be based on customer type, geography, contract size, order frequency, or service level. It helps managers avoid broad conclusions such as “this product is unprofitable” when the real issue is a specific use case or commercial arrangement.
Use the findings constructively. A difficult segment may require a revised price, minimum order quantity, service tier, or different channel rather than an immediate withdrawal of the product.
🔁 Look beyond the first transaction
Some products are profitable because of what follows them. A durable machine may lead to profitable maintenance contracts; an entry-level service may lead to renewal; a core item may produce repeat purchases of compatible consumables.
This is sometimes described through customer lifetime value: the expected value of a customer relationship over time. Lifetime estimates involve uncertainty, so they should be based on observed retention, repeat buying, and service costs rather than optimistic assumptions.
Long-term value can justify a modestly profitable first sale. It should not be used as a vague excuse for persistent losses where customers do not actually return or expand.
🧩 Recognise strategic products and portfolio roles
Not every product must maximize standalone profit. Some products attract customers, complete a range, protect a key account, use spare capacity, or make a higher-margin purchase more likely.
These strategic roles are legitimate, but they need to be explicit. Label a product as a traffic driver, bundle component, capability builder, or relationship product, then define the evidence that would show it is performing that role.
Without this discipline, “strategic” can become a label for products that are simply hard to discontinue. The business should still understand the cost of maintaining them.
⏱️ Measure capacity consumed, not only money spent
Some products consume scarce capacity: skilled technician hours, machine time, design attention, production slots, or limited warehouse space. A product with a positive contribution may still be a poor choice if it displaces a more profitable use of that bottleneck.
When capacity is constrained, compare contribution per constrained unit. For example, a workshop with limited technician hours should consider contribution per technician hour, not just contribution per job.
This approach is particularly useful in service firms, manufacturing plants, hospitality, and project-based businesses, where the scarcest resource may not be cash or inventory.
🗓️ Adjust for seasonality and product life cycle
A short reporting period can create misleading rankings. Seasonal goods may carry costs long before their selling period, while new products may have launch costs that established products no longer bear.
Review several comparable periods where possible. Separate one-off development, launch, clearance, or supply disruption costs from recurring operating costs, while keeping them visible for investment decisions.
A mature product with declining demand may remain profitable today but create future markdown risk. A new product may be temporarily inefficient while processes stabilize. Context prevents hasty decisions.
📋 Create a practical profitability dashboard
A dashboard should help people act, not merely display every available metric. Start with a product table that can be filtered by product family, channel, customer segment, and time period.
Useful fields often include:
- net sales and units sold;
- gross profit and gross margin;
- variable selling costs and contribution margin;
- return rate, inventory held, and stock turnover;
- allocated operating costs, where relevant;
- total product profit and trend versus prior periods.
Show the source and date of key data. A dashboard that explains assumptions builds more trust than one that claims unrealistic precision.
🔄 Establish a repeatable review process
Profitability is not a one-time calculation. Supplier prices, wages, exchange rates, competitor actions, platform fees, return patterns, and customer expectations all change.
Set a review rhythm that fits the business. Fast-moving products may need monthly monitoring; stable business-to-business contracts may be reviewed quarterly or when costs change materially. Assign ownership for updating product costs and challenging unusual results.
Use a consistent sequence: validate data, identify meaningful changes, investigate causes, decide actions, and later check whether those actions worked. This turns analysis into management rather than reporting.
🧪 Test decisions before scaling them
When the analysis identifies a weak or promising product, avoid assuming the first solution is correct. Test a targeted change where practical: a revised price, different package size, adjusted shipping threshold, improved product specification, or removal of an unprofitable option.
For example, a business might trial a minimum order value for a bulky item in one region. It should then compare contribution, conversion, complaints, and operational effects against a suitable baseline before extending the change.
Tests reduce risk, although results can be distorted by seasonality or small volumes. Document the period and conditions so conclusions remain proportionate.
⚠️ Avoid common profitability analysis traps
Several shortcuts produce confident-looking but weak conclusions. Watch for these recurring problems:
- using list prices instead of net realised revenue;
- ignoring returns, delivery subsidies, or payment fees;
- treating an arbitrary overhead allocation as an unquestionable fact;
- comparing a seasonal month with a normal month;
- counting a bundle’s sale without assigning its discount across components;
- dropping a product because of low allocated profit without considering its contribution or strategic role.
The remedy is not endless complexity. It is choosing the costs and time frame that are relevant to the decision, then stating the assumptions clearly.
🛠️ Turn findings into product actions
Different profitability patterns call for different responses. High-contribution products with reliable demand may deserve stronger availability, thoughtful promotion, and protection from unnecessary discounting. High-margin but low-volume products may need better discoverability or a clearer target customer.
Low-profit products are not all the same. Their economics may improve through supplier negotiation, redesign, batch changes, price adjustment, simplified packaging, altered service terms, or a different channel. If no credible improvement exists, reducing the range may free cash and management attention.
Make one decision at a time where possible, and track the financial effect. Removing complexity can be as valuable as chasing additional sales.
🤝 Communicate results without creating blame
Product profitability crosses functions. Finance holds cost data, sales understands customer agreements, operations sees process effort, and marketing knows campaign intent. A useful review brings these perspectives together.
Present results as questions to investigate rather than accusations. A high support cost may reveal a training problem, unclear instructions, or a quality issue; it is not automatically evidence that a team has failed.
Shared definitions are essential. When everyone agrees on what “net sales,” “variable cost,” and “product profit” mean, debates can focus on improving decisions rather than arguing about the spreadsheet.
🧭 Focus on the decision, not a perfect number
Product-level profitability is inherently approximate when shared resources are involved. Chasing a perfectly precise allocation can consume more effort than the decision warrants.
Use a level of detail proportionate to the stakes. A routine price review may need solid unit contribution data. A decision to discontinue a major product line may require scenario analysis, customer impact assessment, capacity consequences, and a more complete view of fixed costs.
The most useful analysis makes uncertainty visible while still guiding action. A range of plausible outcomes is often more honest and more valuable than one overconfident figure.
✅ The core principle: measure what each product truly contributes
The most profitable product is not automatically the most expensive, the most popular, or the one with the highest percentage margin. It is the product that creates the strongest economic contribution after the costs and constraints relevant to the decision are understood.
Begin with net revenue and direct cost, then add variable selling costs, returns, channel effects, inventory demands, capacity use, and strategic context. Compare total contribution with contribution per unit, and revisit the analysis as conditions change.
That approach gives managers a clearer basis for pricing, promotion, sourcing, product development, and range simplification. It also makes trade-offs visible before they become expensive.
Businesses make better product decisions when they look past sales volume and measure the value each product genuinely leaves behind. 📊💡📈